Jonas Meckling, Clara Galeazzi, Esther Shears, Tong Xu & Laura Diaz Anadon
Abstract
Accelerating energy innovation for decarbonization hinges on public investment in research, development and demonstration (RD&D). Here we examine the evolution and variation of public energy RD&D funding and institutions and associated drivers across eight major economies, including China and India (2000–2018). The share of new clean energy grew at the expense of nuclear, while the fossil fuel RD&D share remained stable. Governments created new institutions but experimented only marginally with novel designs that bridge lab to market to accelerate commercialization. In theory, crisis, cooperation and competition can be drivers of change. We find that cooperation in Mission Innovation is associated with punctuated change in clean-energy RD&D growth, and clean tech competition with China is associated with gradual change. Stimulus spending after the financial crisis, instead, boosted fossil and nuclear only. Looking ahead, global coopetition—the interplay of RD&D cooperation and clean tech competition—offers opportunities for accelerating energy innovation to meet climate goals.
Main
Decarbonizing the economy to mitigate climate change requires accelerating energy innovation. The International Energy Agency (IEA) estimates that 35% of cumulative emissions reductions necessary to achieve the Paris climate goals hinge on technologies that are currently only at the prototype or demonstration phase and require further research, development and demonstration (RD&D)1. Accelerating energy innovation hinges critically on public investment and institutions for RD&D, among other measures such as deployment policies2,3.
For public energy RD&D to help achieve the Paris climate goals, both funding and institutions for energy innovation need to transform. Annual funding for public energy RD&D would have needed to at least double between 2010 and 2020 to enable future energy emissions cuts approximately consistent with the 2° Celsius climate goal1,4,5. Public institutions for energy innovation need to evolve to facilitate the rapid commercialization of technologies6,7, given the lag times between RD&D and technology diffusion8,9,10. In the absence of substantially accelerating energy innovation, mitigation costs and climate damages will probably be much higher than they could be.
In recent years, energy innovation policy has become widely recognized as central to the response to climate change and to green growth strategies11,12,13,14,15. For example, Mission Innovation, a 2015 international initiative, sought to double clean-energy RD&D spending by 202016. Some stimulus packages enacted in response to the 2020 economic crisis have included climate-related investments, such as energy RD&D17.
Yet it remains unclear how and why public energy RD&D funding and institutions have evolved over time and how they vary cross nationally. Understanding evolution and variation in funding and institutions allows us to assess where we stand in energy innovation governance for decarbonization. In addition, analysing the forces of change in the evolution of energy innovation governance is central to identifying levers to accelerate energy innovation. In this study, we examine three specific cases of the theoretical drivers of crisis, competition and cooperation—the 3Cs: stimulus spending in response to the financial crisis of 2008, international cooperation through Mission Innovation and economic competition from China18,19. We thus offer a framework to assess possible drivers of change in energy innovation governance and probe their empirical relevance in three specific cases. In addition, systematic comparative and technology-specific funding data that include China and India have not been available20 nor have institutional data beyond the United Kingdom, United States and China, for which we have only outdated data21. We thus address a major knowledge gap on energy innovation governance as a policy response to climate change, in particular compared with other policies such as carbon pricing or renewable energy deployment policy22.
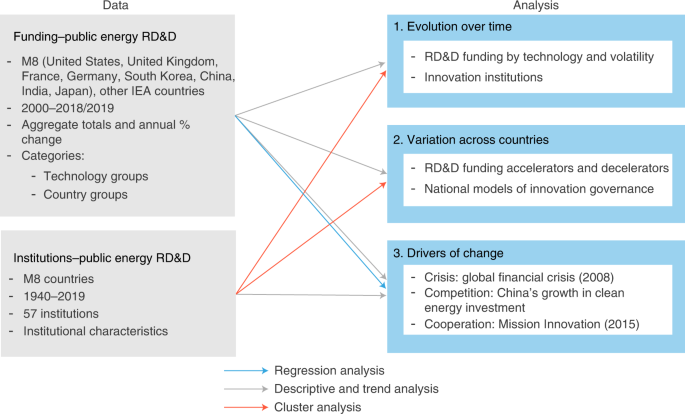
We investigate energy innovation funding and institutions in the Major Eight (M8) (Fig. 1). The M8 include the six largest energy RD&D spenders among Organisation for Economic Co-operation and Development (OECD) countries—that is, the Major Six (M6): France, Germany, Japan, South Korea, the United Kingdom and the United States—plus China and India. We develop two original datasets (Fig. 1): the first is an energy RD&D funding dataset that includes bottom-up data for China and India and IEA countries and the second is an inventory of 57 public energy innovation institutions related to decarbonization across the M8. Our analysis includes three broad technology categories: fossil fuels including carbon capture and storage (CCS), nuclear and new clean (Supplementary Note 1). ‘New clean’ includes renewables, efficiency, hydrogen and fuel cells, power and storage, cross cutting and unallocated, as per IEA definitions. We thus conceptualize the category of new clean as challenger technologies compared with the incumbent high-level technology categories, even if CCS and nuclear can be considered clean from a climate perspective (Methods).
Fig. 1: Schematic overview of study.
We draw on two original datasets—on public energy RD&D funding and 57 institutions across the M8—to analyse the drivers of change in three specific cases, the evolution over time and variation across countries using regression analysis, descriptive statistics and statistical cluster analysis.
Evolution of RD&D funding and institutions
We examine, first, the evolution of RD&D funding by technology category since 2000 for different country groups and, second, the evolution of innovation institutions—agencies conducting, funding or coordinating RD&D—since 2000, compared with pre-2000 innovation institutions.
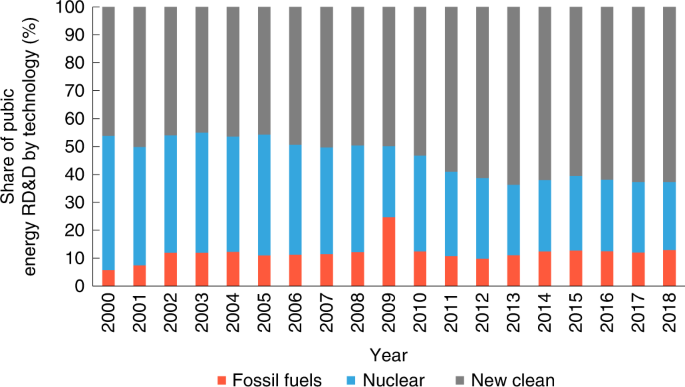
Total energy funding in the M6 plus China increased by 84% from US$10.9 billion to US$20.1 billion (in 2019 US$) between 2002 and 2018 (Fig. 2). The share of new clean energy in total energy RD&D grew in the M6 plus China from 46% to 63% at the expense of the share of nuclear, which decreased from 42% to 24%, while the share of fossil fuels stagnated. Thus, while the new clean-energy RD&D share grew, fossil fuels remain deeply ingrained in public energy RD&D. Notably, China went from US$90 million to US$1,673 million in fossil fuel RD&D between 2001 and 2018.
Fig. 2: Percentage of RD&D funding in fossil fuels, nuclear and clean energy in the M6 plus China country group.
Our database contains no data for China before 2001 and for South Korea for 2000–2001 and 2003 (it was missing its IEA submission). Supplementary Fig. 1 contains data and figures on more granular technology categories and country groups between 2010 and 2018, including hydrogen, efficiency and storage.
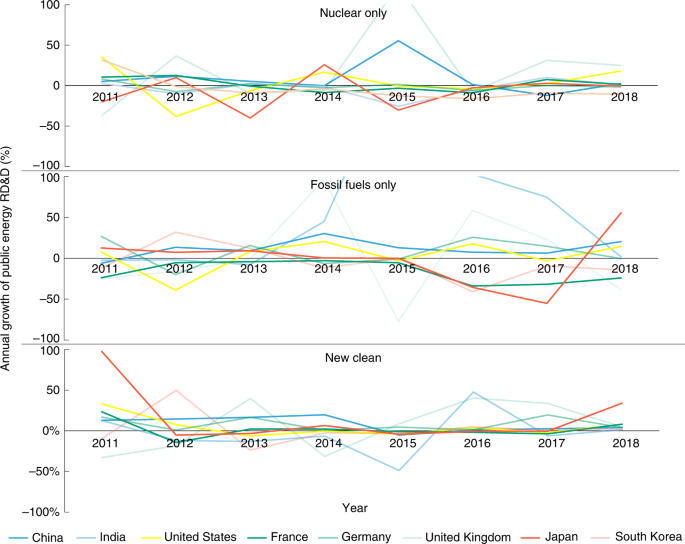
Understanding volatility across technologies is important because consistent RD&D support is more likely to yield the long-term energy innovation needed to address the climate challenge23,24. New clean-energy funding across the M8 experienced the least number of volatile years, defined as the number of years in which the change exceeds 50%, compared with nuclear and fossil fuels (Fig. 3). The comparatively high volatility of fossil fuel RD&D could be due to the fact that some fossil fuel projects (particularly CCS) can be very capital intensive6,25,26.
Fig. 3: Volatility of RD&D funding by technology category.
Volatility is measured as annual funding changes in percentage terms (we show data for 2010–2018). We cut growth rates above 100% to better zoom in on the lower-range variation. The above-100% values are: nuclear: 124% for the United Kingdom in 2015, fossil fuels: 247% and 103% for India, years 2014 and 2015. Volatility also varies across countries (Supplementary Fig. 11).
Next to funding levels, the design of innovation institutions matters for innovation outcomes27. The urgency of the decarbonization challenge requires, in particular, greater focus on designs that facilitate technology commercialization28.
Examining all public institutions that are tasked with supporting energy innovation, we identify—on the basis of the dataset developed and the cluster analysis—three major types of institution by primary function: Performers, Funders and Coordinators (Supplementary Table 23). Performers either exclusively conduct research in house in government labs or pursue a mix of in-house research and delegating research to third-party performers. Funders allocate RD&D funds to third-party performers, including government, private, non-profit or public–private performers. Coordinators focus almost exclusively on coordination across RD&D functions.
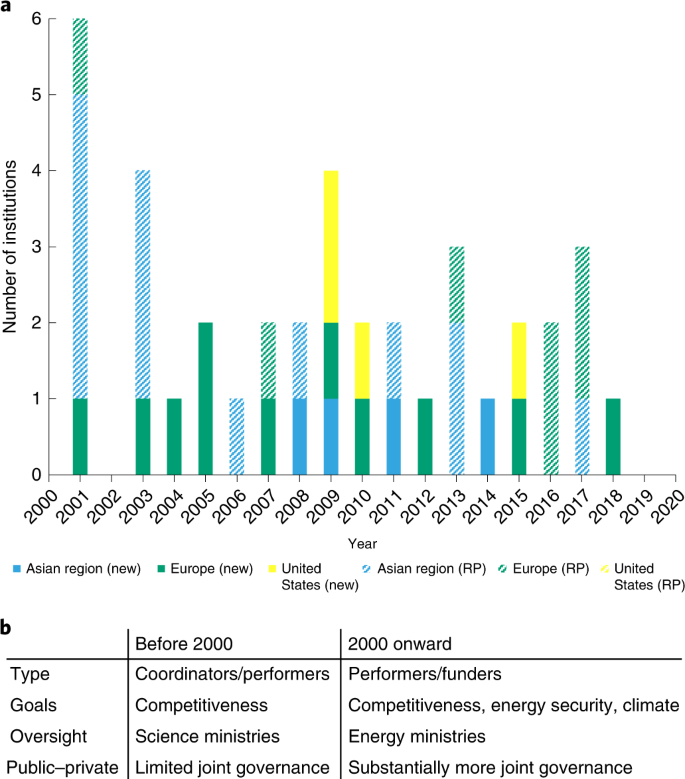
A notable number of new and repurposed institutions emerged since 2000 (Fig. 4a). Post-2000 institutions were created during a period in which climate change gained traction as a policy problem. They exhibit similarities and differences with pre-2000 institutions (Fig. 4b).
Fig. 4: Timeline of new and repurposed energy innovation institutions by cluster.
a, Number of new or repurposed institutions (RP) post-2000, by regional cluster. b, Characteristics of pre-2000 and post-2000 public energy innovation institutions (Supplementary Table 21).
Performers represent, by far, the largest share in the institutions created before (72%) and created or repurposed after (50%) 2000 (Supplementary Table 24). The continued high share of Performers in the new or repurposed institutions post-2000 may reflect that governments find it hard to transform existing Performers to take on new technology challenges. This may be due to lock in of culture29 and/or expertise of existing Performers30. In the countries for which we have data, public Performers also play a major and growing role in conducting publicly funded RD&D compared with other performers such as private firms (Supplementary Fig. 2).
The biggest difference across the time periods is the governance of innovation institutions: science ministries oversaw 56% of all institutions created pre-2000 but govern only 15% of post-2000 institutions, while energy or economic ministries govern 46% of post-2000 institutions. This probably reflects the growing importance of energy RD&D for energy policy goals. With energy ministries overseeing energy RD&D, there is greater visibility, level of activity and accountability regarding energy-related RD&D goals.
Post-2000 institutions have a greater focus on bridging RD&D and deployment funding, with 36% of institutions including this function explicitly post-2000 versus 11% pre-2000. There is also a greater explicit role for providing funding to start-ups or small firms: 13% for post-2000 versus 0% for pre-2000 institutions. In addition, they exhibit higher shares of joint governance by government and business representatives. Together, these institutional changes suggest an emerging shift towards institutions focused on addressing the valley of death between the lab and markets6,29. While institutional design changed to some extent, new institutions govern only a small fraction of total energy RD&D funding.
Variation in RD&D funding and institutions
Moving beyond the evolution of energy innovation governance globally over time, we here show cross-national variation in funding and governance models.
We find two overarching differences in RD&D funding trends across countries. First, we identify a growing funding gap between the M8 and the rest of the world. After the financial crisis, the rest had much higher new clean-energy RD&D growth rates, on average, than the M8. This changed after Mission Innovation in 2015, when M8 countries—already growing from a larger funding base—displayed higher average growth rates for both total and new clean-energy funding compared with the rest (Supplementary Table 20). This disparity in annual funding growth rates could ultimately lead to a widening energy innovation gap between major and smaller economies.
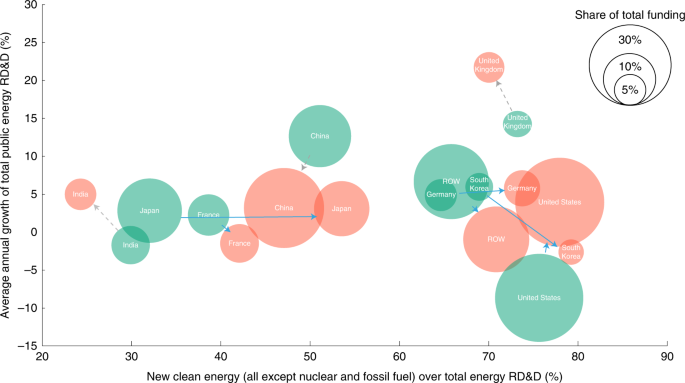
Second, while the United States, China and Japan account for almost two-thirds of new clean-energy RD&D (with China having grown, by far, the most since 2000), we identify accelerators and decelerators in new clean-energy RD&D funding for 2010–2018, the post-financial crisis period, by mapping M8 countries’ total energy RD&D growth rates onto their new clean-energy shares in total energy RD&D (Fig. 5).
Fig. 5: Clean-energy leadership by country.
The light green bubbles show the average annual value 2010–2012, and the light red bubbles represent the average annual value 2016–2018. The bubble size shows the country’s share in total public energy RD&D investments in the IEA plus China and India. The total average value for 2010–2012 was US$22.9 billion and for 2016–2018, US$23.5 billion. Solid blue arrows denote accelerators, and dotted grey arrows denote decelerators. ROW, rest of the world, refers to all IEA countries beyond the M8.
We refer to Germany and the United States as absolute accelerators because they increased or maintained both the energy RD&D growth rate and the share of new clean-energy funding in 2016–2018 compared with 2010–2012. The United States stands out by having the largest amount in global total energy RD&D in 2018 US$ in market exchange rates. France, Japan, South Korea and the rest of the world instead are relative accelerators, as their energy RD&D growth rates declined or stagnated, while their new clean-energy share grew.
China is an absolute decelerator as its growth in total energy RD&D spending slowed down and its share of new clean energy declined between 2010–2018, although its RD&D funding increase since 2000 has been unparalleled. The United Kingdom and India are instead relative decelerators because they increased the rate of growth of total RD&D, but new clean energy as a share of total public energy RD&D retrenched, and fossil fuels and nuclear grew.
Taken together, this suggests that the momentum for increasing public new clean-energy RD&D over the last decade lay (as opposed to 2000–2018) in the industrialized economies of the United States, Germany and Japan, with emerging economies losing momentum in terms of the share of new clean-energy RD&D, though China remains the second-largest contributor to both total and new clean-energy RD&D.
Apart from funding trends, countries also vary in their public institutions for energy innovation. While research suggests that models of public innovation governance generally vary across countries31,32,33, it has been unclear how these models vary specifically in energy innovation. We find that national models of energy innovation governance fall—after robustness checks (Supplementary Note 8)—along regional lines: we refer to them as the Asian, European and US model (Table 1). The clear-cut regional differentiation of national models is remarkable as it results from bottom-up cluster analysis of 57 institutions across the M8.
Table 1 National energy innovation models
The Asian model (China, India, South Korea, Japan) centres around a mix of Performers (66% of innovation institutions) and Coordinators (31%). Innovation institutions in Asia primarily advance national competitiveness and economic growth, favour incremental innovation and are highly centralized in economy and science ministries. Formal joint governance by industry and government representatives is very limited. The Asian model has seen a medium rate of institutional change. Asian countries among the M8 increased new clean-energy RD&D funding on average by 247% between 2000 and 2018.
The European model (France, Germany, United Kingdom) shares with the Asian model the mix of Performers (40%) and Coordinators (30%) and the lack of an explicit focus on next-generation technologies as a goal. The European model differs from both Asian and US models in the dual policy goals of growth and climate mitigation. It is, in fact, the only national model with climate mitigation consistently as a goal. Administrative oversight lies primarily with economy or research ministries, with moderately centralized governance and broad funding goals. Innovation agencies feature joint governance arrangements through industry representation on boards mainly to facilitate technology commercialization. The European model underwent substantial institutional change, though less than the United States, but new institutions manage only a small fraction of total RD&D, and the repurposed institutions generally lack novel designs. European countries among the M8 grew new clean-energy RD&D funding by 936% between 2000 and 2018, taking, by far, the lead among the three national models.
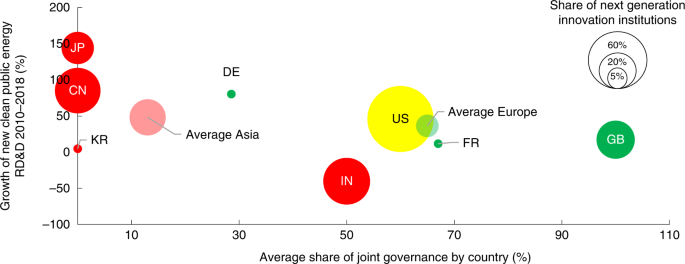
The US model largely lacks separate Coordinators to manage the system beyond the Department of Energy7, while it has the highest share of Performers (80%) among innovation institutions compared with the other models. It shares the growth goals with other economies and is focused on energy security as a second important goal. It starkly differs from other models in its explicit focus on next-generation technologies34 (Fig. 6). The United States sits between Asia and Europe in the level of joint governance of institutions with the private sector. Lastly, the United States has a high rate of institutional change, particularly in new institutions. As in the European Union, the new institutions represent only a small part of RD&D. The United States grew new clean-energy RD&D by 127% between 2000 and 2018, the lowest growth among the three national models for the 2000–2018 period. However, since 2010, the new clean-energy RD&D growth rates of all three national models have converged (United States: 46%, Asia: 48%, European Union: 36%; Fig. 6).
Fig. 6: Funding and institutional characteristics by national models as they relate to decarbonization.
On the y axis, we focus on joint governance of innovation institutions as a measure of the extent to which institutions facilitate technology commercialization, an institutional function deemed critical to accelerate energy innovation. Red denotes the Asian national model, green the European model and yellow the US model. Two-digit codes indicate countries: China (CN), France (FR), Germany (DE), India (IN), Japan (JP), South Korea (KR), United Kingdom (GB), United States (US).
Overall, the persistence of regional differences in national models of energy innovation governance reflects long-standing patterns of state structure across the three regions. We observe, however, limited convergence across the European and US models on increased private sector participation and convergence across all three models on new clean-energy growth rates over the past decade after the European model had initially led.
Drivers of change in RD&D funding and institutions
We examine the extent to which the financial crisis, international cooperation through Mission Innovation and economic competition from China are associated with an expansion of funding and a transformation of institutions (Fig. 7). Several of these drivers probably play a role, and we here probe their likely relative importance in the evolution of energy innovation governance across the M8 as a whole. We offer the first quantitative assessment of the association between these dynamics and innovation governance. Other work has primarily focused on the effect of crises and competition on innovation itself, but not on public RD&D policy. We discuss the association of three specific cases of the 3Cs with new clean energy here and provide extended analysis for the association with new clean energy, nuclear and CCS in Supplementary Notes 10 and 11.
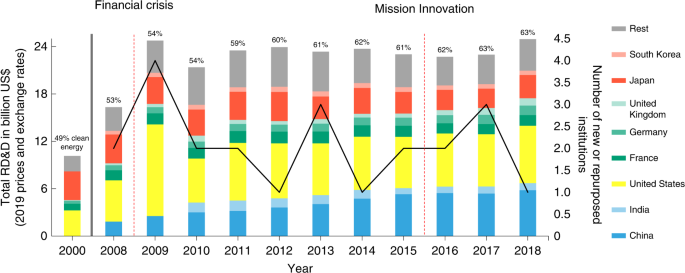
Fig. 7: Evolution of RD&D funding by country and of innovation institutions.
Total energy RD&D funding by country (columns, left axis), new or repurposed institutions (solid black line, right axis), percentage of total RD&D funding allocated to new clean (text above columns); financial crisis and Mission Innovation (vertical red dashed lines). The 2000 bar and clean percentages do not include China or India, and the 2008 and 2009 bars and percentages do not include India. See Supplementary Notes 1–6 for details on data collection. The total known energy RD&D funding for the M8 plus rest of IEA in 2018 was US$24.9 billion (2019 prices and exchange rates).
A potential additional factor shaping energy innovation governance beyond the 3Cs is energy prices. They are known to affect energy innovation efforts measured in patents35,36 and could theoretically also be a driver of RD&D policy35,37. Oil prices were high in the 2000s and could explain some of the expansion of new clean-energy RD&D funding in the early to late 2000s, which predates our analysis of drivers38. Oil prices spiked during the 2008–2009 economic crisis and declined shortly after. They were relatively low since 2014, a period during which we find statistically significant increases in funding growth rates for new clean-energy RD&D funding compared with previous periods. Together, this suggests that oil prices are unlikely to be the only driver of energy innovation governance since 2000. In particular, the post-2014 expansion of energy innovation governance warrants further explanation. We, therefore, here examine associations in funding trends and institutional change with three potential drivers—the financial crisis, Mission Innovation and clean-tech competition with China.
First, economic crises—resulting from an external shock or emerging more slowly—can create openings for governments to grow funding through fiscal stimulus and to create new institutions. The oil crises of the 1970s and the recent economic crisis in the wake of policy responses to the COVID-19 pandemic are examples. We assess the association of the financial crisis of 2008, the first major economic crisis in the new clean-energy era, with changes in trends in energy innovation governance. We report statistical associations between the crisis and funding trends over the following three years.
Following the financial crisis, total energy RD&D and RD&D for fossil fuel plus nuclear increased statistically significantly for both the M7 (M8 minus India, given data availability) and all countries. This funding increase probably results from financial crisis recovery programmes (Supplementary Notes 10 and 13). However, new clean-energy RD&D did not grow significantly for the M7 after the financial crisis. This suggests that the response to the (not energy-related) economic crisis exhibits substantial path dependence in funding allocations by boosting incumbent types of energy RD&D in major economies. Only small contributors to global energy RD&D (outside the M8) expanded new clean-energy RD&D significantly while also growing fossil fuel and nuclear RD&D. We further probe the causal relationship between the stimulus spending and the increases in total public energy RD&D by reviewing detailed analyses of recovery packages (Supplementary Note 13).
The potential effect of the financial crisis on RD&D spending thus aligns with the finding that economic crises led to some increases in RD&D spending39. It differs from the 1970s energy crises and World War II in that financial crisis-related stimulus spending is not associated with changes in the allocation of funding across different energy technologies in the biggest RD&D spenders40. One reason may be that the nature of a non-energy related economic crises creates immediate demand for supporting industries broadly, whereas an energy crisis or a war requires a focus on novel technological capabilities to cope with the crisis.
Second, much hope rests on accelerating energy innovation through global cooperation, though it has been unclear whether global cooperation follows or leads the expansion of domestic energy innovation governance12. We find that Mission Innovation is associated with a significant increase in growth rates of both new clean energy and the combination of new clean energy and nuclear RD&D for the M8 in the following three years. Several factors could be at play, but government documents relating to energy RD&D budgeting in the majority of the M8 show clear references by both the executive branches and the legislatures to Mission Innovation as a rationale for expanding clean-energy RD&D funding (Supplementary Note 13). The association only exists for the M8, not for Mission Innovation member countries as a whole nor for all countries (Supplementary Note 11).
International cooperation in the form of country-level pledges is thus only associated with increased efforts for major economies, not all parties to the initiative. This reflects an emerging gap between large energy innovation leaders and smaller laggards, even within Mission Innovation. Interestingly, unlike during the financial crisis, we do not find a surge of institutional change after the launch of Mission Innovation.
Third, global clean-tech competition has been intensifying with a growing role of new players, most notably China41,42. While research shows that the effect of global competition on domestic innovation activity—measured in patents—is ambiguous43, we do not know whether increased competition also incentivizes governments to expand energy RD&D policy. Our analysis offers a first foray into answering this question with regard to competition from China. Our findings are twofold. One finding is that competition is not associated with a statistically significant punctuated policy change, as crisis or cooperation. This results from statistical tests of whether the growing role of China in clean-energy technology markets—across technologies and by individual technology—is associated with a significant increase in clean-energy RD&D among M6 countries (Supplementary Note 12).
By contrast, evidence suggests that competition is a cumulative—as opposed to a punctuated—force that creates gradual change in innovation governance across a range of countries and technologies at different points in time. When solar and wind industries first emerged at greater scale in Europe and the United States in the early 2000s, China started expanding its new clean-energy RD&D considerably, growing—with a single-year exception—at double-digit rates between 2003 and 2014 (Supplementary Note 12). Meanwhile, the M8 and all countries have been gradually growing new clean-energy RD&D since 2000. Political justifications for a RD&D push specifically mention the growing competitive threat from China. This includes US RD&D investments after the 2008 crisis25, current US investments26, Germany’s RD&D push into electric vehicles44 and the European Commission’s RD&D investments in the EU Green Deal45. Competition from China has thus gained salience over time.
We also find that China’s rise as a major player across clean-energy markets is associated with an uptake of the goal of competitiveness and economic growth in new and repurposed institutions. We identify the year 2014 as point in time when China emerged as a major competitor across a range of low-carbon technologies (Supplementary Table 34). Between 2000 and 2014, 74% of new and repurposed institutions had that goal. Between 2015 and 2018, 88% of institutions had competitiveness and economic growth as a key goal. Similarly, we see a notable increase in joint governance to advance RD&D closer to commercialization. Before 2015, 39% of institutions featured joint governance, compared with 63% of institutions created or repurposed since 2015.
Another finding is that the effects of competition from China during this period on energy innovation governance probably vary across technologies. Preliminary evidence suggests that both how shippable a technology is and the intensity of competition matter. On average (but not in a statistically significant way), RD&D growth rates for onshore wind increased among incumbent producer countries in the M6 after Chinese firms entered the market. By contrast, RD&D growth rates for solar photovoltaic (PV) turned negative in incumbent producer countries in the M6 after China entered large-scale solar PV manufacturing, supported by major government investment (Supplementary Table 36). Key wind technology components are not easily shippable, resulting in regional markets and thus market barriers for Chinese competitors. Solar PV components are easily transported, which has led to a global market. This, combined with Chinese government support in the late 2000s and subsequent solar firm bankruptcies in incumbent producers, undermined incentives in those countries to continue to invest in solar RD&D. It suggests that global clean-energy technology competition from China that eliminates competitor firms may not incentivize greater public RD&D spending. Countries may need some relevant domestic manufacturing base to have incentives to substantially invest in RD&D for specific clean technologies.
Discussion
While clean-energy RD&D funding has been growing, funding allocations for fossil fuel RD&D and institutional design are highly path-dependent and did not grow and pivot to the extent needed to promote energy innovation at a scale necessary to meet the Paris climate goals46. This gives urgency to the growing call for national energy innovation missions and expanding public energy RD&D funding47,48,49.
The CCS share of fossil RD&D is growing across the M8, but it is concentrated in a few OECD countries, and fossil fuel RD&D remains sticky. In addition, the emerging energy innovation gap between the M8—with the US, Germany, and Japan exhibiting the strongest growth over the last decade—and the rest could translate into concentration of the economic benefits of decarbonization in major economies.
Our findings challenge us to reconsider macro forces of change in expanding and transforming energy innovation governance, in particular the interplay of cooperation and competition.
First, the fact that the financial crisis is associated with an increase in total energy but not new clean-energy RD&D spending in major economies points to the challenges of leveraging some types of economic crisis to shift allocations across large technology categories. Public investment in distress benefits incumbent sectors and technologies. Recent government responses to the pandemic-induced economic crisis also reflect this: stimulus packages did not match governments’ rhetoric on a green recovery50.
Second, while Mission Innovation countries as a whole failed to double clean-energy RD&D spending by 2020, M8 countries significantly increased their spending after Mission Innovation. This is an encouraging sign for the potential effectiveness of RD&D cooperation among major economies in increasing clean-energy RD&D. The fact that the M8 account for the large majority of energy RD&D suggests that cooperation among major players could help to expand innovation governance commensurate with net-zero goals, albeit with the distributional effects mentioned above.
Third, while evidence suggests that international technology competition with China likely is a gradual driver for national efforts to strengthen energy innovation governance, it bears the risk of turning into conflict that undermines cooperation on RD&D and clean technology trade, resulting instead in greater protectionism. To effectively expand and transform energy innovation governance, policymakers thus need to advance global coopetition, the managed interplay of cooperation and competition, through both domestic and international measures.
Domestically, this calls for greater policy integration between energy RD&D and industrial policymaking to turn RD&D efforts into effective competitive strategies. While this is happening on the margins, as we show, in some countries it may require new government agencies to design and manage industrial policy51. These could promote technology- or sector-focused public–private cooperation such as the Offshore Wind Accelerator in the United Kingdom or build on the strengths of the Energy Innovation Hubs in the United States, which, in cases such as the Joint Center for Energy Storage Research, involves significant industry participation. Such initiatives could build broader political support for energy RD&D by tying it directly to economic policymaking, advance technology commercialization and mobilize greater private RD&D spending.
To strengthen the commercialization orientation of energy innovation institutions, creating new ones is important but not sufficient23,52,53. The transformation of some existing institutions is key to be able to pivot energy innovation institutions as a whole towards new clean energy. This suggests that organizational transformation strategies, including for personnel transition and turnover, are important complementary measures.
Internationally, leveraging coopetition requires—beyond RD&D initiatives—cooperation on rules and standards that facilitate trade in environmental goods. Both unfair competition and protectionism could stymie efforts to increase RD&D. The story of solar PV sounds a warning. Global RD&D for solar PV declined in the wake of China’s national solar strategy and the subsequent emergence of solar tariffs54. A trade club for climate goods would thus need to establish rules for both fair and open trade. Such trade benefits could also be tied to public RD&D commitments to further incentivize RD&D investment55,56.
While coopetition is an emerging pattern in energy innovation, it is not a self-propelling force. It remains critical to develop and transform institutions that enhance domestic competitive capabilities and channel global competition in ways that incentivize greater public investment. Otherwise, the path-dependent nature of energy innovation governance continues to risk not delivering the technologies we need to meet climate goals.
Methods
Scope of analysis
Our analysis focuses on funding and institutions that manage public energy RD&D related to decarbonization in eight major economies, the M8. To provide context for the relevance of public energy RD&D funding: in general, in OECD countries, governments fund just under one-third of all RD&D57. For energy, the very limited data available from the IEA suggests a relatively large spread from 17% to 72% (ref. 58) for the share of public funding in total energy RD&D funding.
The M8 include the six largest energy RD&D spenders among OECD countries—that is, the M6: France, Germany, Japan, South Korea, the United Kingdom and the United States—plus China and India. The M6 accounted for almost 80% of global public energy RD&D investment tracked by the IEA in 2016. We add China and India, for which detailed energy RD&D data from 2010 onwards had not been available by the IEA or other entities.
We use three broad technology categories: fossil fuels including CCS, nuclear and clean energy. ‘New clean energy’ refers to the combination of renewables, efficiency, hydrogen and fuel cells, power and storage, cross cutting and unallocated, using the definition of these more granular technology categories used by the IEA. We thus define the category of new clean energy as newer energy technologies when compared to the incumbent high-level technology categories. We focus on new clean energy for two reasons. First, diversifying energy innovation governance beyond incumbent technologies has presented a major political challenge59. Second, major decarbonization scenarios see new clean play the largest role in pathways to stabilize warming at 1.5 °C (ref. 60). We develop two original datasets: the first is an energy RD&D funding dataset that includes data for China and India and the second is an inventory of 57 public energy innovation institutions across the M8 and a coding of their key characteristics.
Funding data collection
Our funding data draw first on the 2020 IEA Energy Technologies RD&D database for the M6. Supplementary Note 1 provides the IEA technology definitions, sources and coverage. We construct comparable datasets for China and India using public official spending records and describe these below. For completeness, we also include energy RD&D data from the IEA for other OECD countries as regional aggregates beyond the M6.
The IEA recently published data across seven technology categories for China and aggregated across all energy technologies for India between 2015 and 2019. Both the level of disaggregation and the time frame are insufficient for our analysis. Therefore, we construct our own more granular and long-term datasets for China and India. These include data by technology from China since 2000 and from India since 2010, using the same categories as the IEA.
For China, we collected public energy RD&D data from the official China Statistical Yearbook on Science and Technology61. We identified 12 technology-oriented categories in the China Statistical Yearbook database and we matched them with the IEA energy RD&D classification, as shown in Supplementary Table 3. The yearbook included information both on intramural and extramural expenditure. We included only the intramural expenditures (the contributions from government funders) and did not include in the database the external expenditures (for example, the contributions from non-government funders). Creating the China dataset was a major effort, and we provide a more extensive description in Supplementary Note 4. Our data collection methods for China also included energy RD&D funding data from key institutions and by performer. These do not explicitly inform the analysis in the main article, but more information and discussion can be found in Supplementary Note 4.
For India, our main sources of data are Union Budget expenditure documents which show annual spending by the government of India, disaggregated by ministries and departments62. Union Budgets’ major strengths are that they compile funding data using similar methods over the time frame covered: 2010–2018 (we considered 2010 an adequate time coverage given source data consistency). It therefore allows for a robust and consistent overview of the evolution of how much each department/ministry is spending by activity and a comparison of amounts across institutions and types of energy technology over the time frame of interest. We offer a more detailed discussion of strengths and weaknesses of Union Budget data in Supplementary Note 5.
We attempt to mitigate some potential weaknesses of Union Budget data, which cover some programmes that contain energy projects but are not fully focused on energy, by complementing the data process with Web of Science searches. We estimate that in these programmes, the percentage of publications attributed to energy is proportional to the percentage of funding to energy, by funding body. This method is especially helpful for large ministries that conduct research in various fields and do not specify areas of research in Union Budget expenditure budget lines. It allowed us to incorporate estimates for the Department of Higher Education (within the Ministry of Human Resource Development) and the Ministry of Science and Technology (specifically, the Department of Science and Technology, the Department of Biotechnology, the Department of Scientific and Industrial Research). We provide a step-by-step description of this method in Supplementary Note 5.
Funding data analysis
We combine our own data from China and India with the IEA dataset to investigate the extent to which the years of financial crisis, Mission Innovation and technology competition displayed statistically significant changes in funding growth rates compared with previous trends. To do so, we run panel regressions with country-fixed effects.
The dependent variable is annual percentage funding change in deflated millions of US$, for total energy RD&D and for clean-energy RD&D. We focus on clean energy (a high-level technology category that includes renewables, energy efficiency and other technology groups, as described above) because we do not have data on public energy RD&D expenditures for China on the more granular category of renewables going back to 2001. The inclusion of China is an important feature of our dataset because the country is a major energy RD&D funder.
The independent variables are dummies for time periods of interest, which vary depending on the analysis (crisis, cooperation and competition). More information on the treatment of the variables can be found in Supplementary Note 10. For robustness and additional insight, we perform the analysis on several sub-samples of country groups, such as M8, all IEA plus India plus China, Mission Innovation, non-Mission Innovation and more (Supplementary Tables 28 and 31).
While the regression analysis examines associations between drivers and funding trends, we use process tracing to probe possible causal links between drivers and increases in energy RD&D funding. We examine government documents—from the executive and/or the legislature—and third-party reports to examine links between RD&D funding increases and the financial crisis, Mission Innovation and competition from China (Supplementary Note 13 provides more details on data sources).
Institutional data collection
For each of the sample countries, we identified the major government agencies (henceforth ‘institutions’) that are involved in energy innovation governance as it relates to decarbonization. The selection of 57 innovation institutions was the result of extensive background research. We started with the Mission Innovation country reports and investigated any institutions referenced within those reports. We also reviewed current major climate or energy policies and considered the institutions involved in these policies or programmes. All this work involved studying primary source government reports and websites to ensure that no institutions important to energy RD&D were omitted. Finally, we verified the importance of each of these institutions through secondary academic literature if it existed.
The criteria we used to select the institutions was as follows:
The institution had to be currently active.
Our institutional analysis relied on coding institutions of their current (as of 2019) features, so we chose to omit institutions that no longer existed by that year.
The institution had to be a public institution (or originated as a public institution).
Under this criterion, we excluded some research institutes that are not fully or primarily funded by public funds.
The institution had to be involved with the allocation of energy RD&D or involved with energy innovation policy related to decarbonization.
We considered the following technologies and areas of activity as related to decarbonization: solar, wind, ocean, biofuels, geothermal, hydroelectric, nuclear, carbon capture and sequestration, energy efficiency and energy storage.
For each of the 57 public energy RD&D institutions, we code ten institutional dimensions to capture features and characteristics of the agency (Supplementary Note 8 for coding scheme). The ten dimensions are existing/new, function, goals, type of innovation, administrative oversight, centralization of goals, breadth of goals, joint governance, co-financing, in house/delegation. Literature on public policy, public administration and science and technology policy, with a particular focus on the energy sector, suggest that these dimensions of institutions matter to innovation policy outcomes. They have not been previously studied together or regarding a set of countries over time. The dimensions were coded for 2019, using publicly available government sources and expert qualitative judgement when necessary. From the coded dataset, we aggregated the institutional dimensions by country to create a country-level dataset (Supplementary Note 8).
It is important to note that with this institutional coding approach, there are inherently a few limitations. First, there are well-known difficulties of capturing the nuances and features of institutions into categorical variables (especially if the variable is a binary choice). Second, we are limited to coding only what is formalized by the institution enough to be published on the institution’s public website. Some policy goals or tacit functions of these institutions may not be formalized in text online, for example.
Institutional data analysis
To identify both institutional-type clusters and country-type clusters, we performed statistical hierarchical cluster analysis. This method was deemed most appropriate given the nature of the data and based on relevant past research63,64,65. In general, cluster analysis is most useful at identifying groups (or trends within groups) without relying on existing priors about how the data should best be organized. Clustering is an ideal method to investigate a larger number of dimensional features defining our unit of analysis and serves as a good tool for conceptualizing the governance of energy innovation institutions. Because we started with the institutional data, which is all categorical, hierarchical cluster analysis (as opposed to k-means methods used for centroid-based clustering) is the most suitable approach.
The analysis was conducted in R. We classified the data as factors and implemented dummy variables where necessary. We then calculated the Gower dissimilarity matrix, employed an agglomerative clustering algorithm with complete linkages and produced the dendrograms for each set of cluster analysis (institution-level and country-level). To determine the appropriate number of clusters (for each set of cluster analysis), we used both the Elbow method and Silhouette method to assess the output. The Elbow method plots the percentage of explained variation as a function of the number of clusters, while the Silhouette method measures how similar the data points within each cluster are, compared with the other clusters. Further discussion of these methods and the robustness checks are in Supplementary Note 8.
Data availability
We use two datasets: the first is an energy RD&D funding dataset that includes bottom-up data for China and India and IEA countries and the second is an inventory of 57 public energy innovation institutions related to decarbonization across the M8. Funding data for IEA countries (France, Germany, Japan, South Korea, United Kingdom and United States) are available from the IEA Energy Technologies RD&D database. Funding data for China and India are available as Supplementary Data 1. The institutional data are not currently publicly available due to additional ongoing analysis of the original dataset by the authors but are available upon reasonable request.
No comments:
Post a Comment