James R. Masterson and Jingwen Wu

China’s economy has developed rapidly in the past 40 years since the reform and opening up. However, China’s irrational economic structure, low efficiency of resource utilization and serious environmental pollution have become important factors restricting the long-term healthy development of China’s economy. More importantly, pollution issues in China seriously affect the development of the regime due to public concerns in terms of health issues. In 2014, senior government officials said publicly that China would “declare war on pollution.” Since then, air pollution has improved to a certain extent, with PM 2.5 levels falling 23.6 percent from 2013 to 2015, but still falling far short of people’s expectations. In 2016, the Chinese government promised in the EEP plan to make up for the shortfall and strengthen environmental protection. The Five-Year Plan initially refers to the Chinese Communist Party’s (CCP) leading role in setting growth targets and launching reforms to map strategies for economic development. Since the 10th Five-Year Plan passed in 2001, all subsequent plans have included regulations and goals for protecting the environment within the agenda.
Internationally, with the rapid development of China’s economy it has developed into one of the largest economies in the world. Accordingly, it has become one of the countries with the most serious air pollution problems. In 2014, China surpassed the United States and became the largest emitter of the greenhouse gases in the world, accounting for 27 percent of global emissions. Environmental problems, especially air problems, are not a local problem but are a regional one. In a recent podcast for the Center for International Strategic Studies, Sandalow said that if China keeps the current rate of greenhouse gas emission, the global average temperature will rise by 3.6 degrees Fahrenheit in 2030. As the biggest country responsible for climate change, the success or failure of China’s environmental policy objectives will have a great impact on the ability of global society to limit human-induced climate change. Examining the effectiveness of China’s environmental policy has global implications.
From China’s domestic perspective, urbanization and economic development indeed alleviate China’s poverty issue. However, there is much evidence that shows the impact of environmental pollution is the main source of morbidity and mortality in China. Air quality has become a major concern of the government. On one hand, social media has pushed air quality to the forefront. As the air quality gets worse, the Chinese government faces domestic public opinion pressure and pressure from international society. Tang et al. show that in the period from 2011 to 2015, about 40 percent of petitions were about air pollution. Even as an authoritarian regime, the government is concerned about public opinion, and has been actively responding to concerns. Evidence shows that Chinese dissatisfaction with environmental conditions has significantly affected the environment-related investment of Chinese provincial governments. Environmental problems bring hidden dangers to personal safety, but also greatly affect the economic vitality of China. Evidence shows that ambient air pollution caused more than 1.6 million deaths in mainland China, while the total economic loss in 2013 was equivalent to 10.9 percent of GDP. Therefore, how the Chinese government responds to environmental problems is essential.
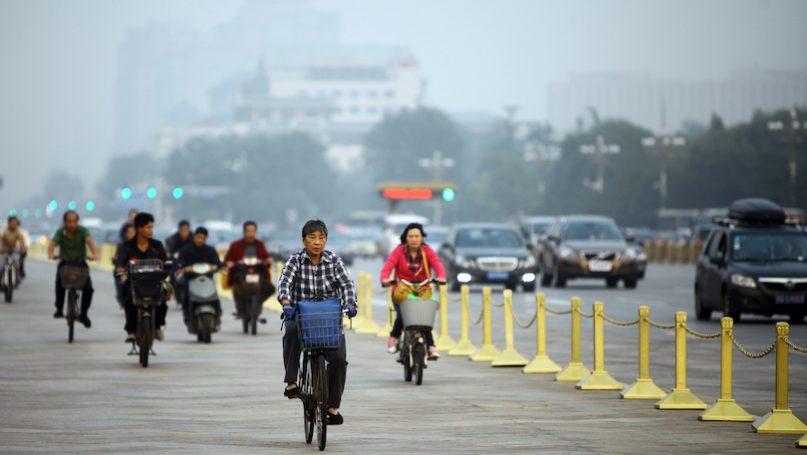
Beijing, in particular, as the capital of China is referred to as the “Fog Capital.” In January 2013, suffocating smog enveloped Beijing for four consecutive days. The particulate matter 2.5 (PM 2.5) in the air reached the highest level in history, causing the airport to close, and respiratory problems among citizens leading to hospital treatment. The air pollution in Beijing in 2013 was called “the end of the air.”
This research assesses the impact of recent PRC policy on air pollution levels in China’s capital city, Beijing. With the rapid development of China’s economy and the rapid expansion of urbanization in China’s major cities, the problem of environmental pollution has become the focus of policy leaders in China, and the world over. The globalization of information sharing has resulted in China’s environmental pollution problem gradually entering the attention of the international public. However, the Chinese government is no stranger to the introduction of environmental protection policies. After realizing the environmental problems in the 1980s, the Chinese government formulated and issued a series of guidelines, policies, laws and measures. However, these were not effective in reducing air pollution. After reviewing environmental laws in China, Wang argues that the legislation was of low quality, had many principles, and was too challenging to implement. 2013 was a terrible year for China’s environment due to extreme levels of air pollution, and become known in China as the PM 2.5 Crisis.
A study based on data from 2013 found that more than 257,000 premature deaths in 31 cities in China were related to high PM 2.5 levels. Therefore, increasing public dissatisfaction with the environmental situation has prompted the government to take environmental issues more seriously. Our study uses daily and monthly air quality data (including PM 2.5 and AQI) from January 1, 2014 to December 31, 2019 from Beijing to assess whether or not there have been significant improvements in Beijing’s air quality since the implementation of the EEP Plan on November, 16th, 2016. Control variables used in the study include wind scale and temperature. Using comparison of means tests as well as mixed-effect regression models, this study measures the association of policy implementation with cleaner air in Beijing with respect to two common indicators of air quality, PM 2.2 and AQI.
Through a variety of tests, the findings show that Beijing experienced a general decline in air pollution prior to the implementation of the policy. Air pollution levels were significantly lower after implementation of the policy compared to prior. When controlling for outside factors, implementation of the policy was found to significantly reduce pollution. Using a two-level mixed-effects regression model, when controlling external factors and comparing post-treatment trends to pre-treatment trends, the results show that the policy implementation period was associated with significantly reducing air pollution in the nation’s capital. It is clear the air pollution in Beijing is improving. However, it is less clear as to whether the implementation of the EEP Plan is the main cause of such reductions.
Importance of Study
Understanding China’s environmental policies and progress towards cleaning up its air is of the utmost importance. China’s rapid economic growth has led to many environmental problems. Its economic development largely depends on coal energy for more than 85 percent of its energy production. Though a vital source of employment helping to lift millions of people out of poverty in China, it is damaging to the environment and has directly led to environmental degradation and to smog encompassing many cities. Researchers at the Berkeley Earth Project found that 92 percent of Chinese people were in sub-healthy air for more than 120 hours in the four months of mid-2014. Such air contamination has caused massive human and financial costs in China. For example, high levels of air pollution severely harm public health. A study by the Institute for Health Impact found that unhealthy levels of PM 2.5 in China in 2017 led to premature deaths of about 852,000 people.
Furthermore, air pollution also brings economic costs. According to a 2015 report by Rand, health problems and lost labor productivity because of air pollution reached 6.5 percent of China’s GDP per year between 2000 and 2010. Similarly, a 2018 examination by the Chinese University of Hong Kong estimates that $38 billion of revenue is lost yearly due to early deaths and lost food production as a result of air pollution.
Ecological Environmental Protection Plan Background
The EEP Plan is a national environmental five-year protection plan. It is also a guiding principle for the sub-national levels of government directly under the national government to follow. The governments at these local levels will formulate detailed implementation rules according to their specific environments, which varies from city to city, and thereby strive to meet the requirements set forth in the EEP Plan. The implementation of the plan is supervised by all levels of the environmental department directly affiliated with MEP. The plan calls for the following approaches to reach its environmental goals.
First, all sub-national levels of governments directly under the national government are to encourage green development, coordinate the relationship between economic development and environmental pollution by supporting green industries, establish green factories and industrial parks as well as eliminate heavily polluting factories. Second, inter-regional and inter-departmental emergency coordination mechanisms are to be set up to handle emergency environmental issues. Third, the NPC requires these sub-national governments to improve the environmental protection responsibility system with clear responsibilities and reasonable division of labor. For instance, the general requirements set forth by MEP states that all governments at the provincial level, autonomous region level, and the prefecture-level formulate their own jurisdictional objectives in combination with the MEP general objectives and their particular conditions. The subordinate governments directly under these jurisdictions shall manage and implement these objectives at different levels. Last, the plan aims to improve law enforcement on pollution emissions. In order to reach this goal, the plan implements a vertical management system to monitor and supervise law enforcement. Vertical management system refers to the independence of the environmental department from the local government to become under the direct jurisdiction of MEP. The environmental department and the local government as two independent local environmental authorities supervise the environmental quality and share the responsibility through coordination, and thereby enhance the law enforcement of the environmental regulations.
Hypotheses
We test the following hypothesis to assess whether or not there have been improvements in Beijing’s air quality since the November 16th, 2016 implementation of the EEP Plan:
Null Hypothesis: The EEP plan does not have a significant impact on Beijing’s air pollution levels (AQI and PM 2.5). Daily AQI and PM 2.5 deviations from the aggregated monthly mean are not significantly different after policy implementation compared to levels prior to it.
Hypothesis One: Implementation China’s EEP plan significantly reduces PM 2.5 (and air quality index) in Beijing. PM 2.5 and AQI deviations from their aggregated monthly mean are significantly lower after policy implementation compared to levels prior to it.
Hypothesis Two: When controlling for outside factors, policy implementation will be a significant factor in reducing air pollution in Beijing. The policy impact on PM 2.5 and AQI deviations will be significant and negative demonstrating that it has significantly reduce air pollution in Beijing.
Scope of Research
The hypotheses listed above are examined using quantitative data from a variety of sources complied into a single database. Data measuring daily Air Quality Index (AQI) and PM 2.5 index published by the Ministry of Environmental Protection for Beijing taken between January 1st, 2014 and December 31st, 2019 are used in the study as indicators of air pollution. Using STATA statistical software, this research adopt a two-level mixed-effects regression analysis to assess the impact of the EEP Plan on reducing air pollution, while controlling for outside factors and seasonal monthly variation in weather patterns that effect pollution levels.
Because this research uses longitudinal data from Beijing over a six-year time period with daily observations of air quality levels and control factors, ordinary least squares regression analysis is not appropriate. While the coefficients are unbiased estimators of the effects of covariates on air quality, there is a liberal bias in the standard errors, resulting in greater likelihood of finding a statistical relationship when one does not exist. As such, this study adopts a mixed-effects model, allowing for fixed effects of the month in which the observation took place. For reasons outlined below, the month in which a measurement took place impacts air quality. From the scatterplot for both PM 2.5 and AQI for Beijing over time, it is clear that there are seasonal trends in both the absolute levels and the deviations from their monthly mean. Controlling for effects at the monthly level will control for latent variables not included in the analysis and measure their effect on air quality, while measuring the variables of interest for their effects.
Dependent Variables
As mentioned above, this study adopts two important observational data routinely measured as an indicator of air pollution: Air Quality Index (AQI) and Particulate Matter 2.5 (PM 2.5). PM 2.5 refers to particles with aerodynamic equivalent diameter less than or equal to 2.5 microns in ambient air. It is associated with the burning of fuel for energy, automotive emissions, as well industrial output from combustible processes. The higher its concentration in the air, the more serious the air pollution is in a given area. AQI is an index of multiple pollutants used by governmental agencies to communicate to the public what the current air quality is or what it is forecast to become. AQI levels range from 0 to 500, while PM 2.5 ranges from 0 to infinity, where in both cases, the higher value, the greater the air pollution. Table 1 below displays the summary statistics of the daily AQI and PM 2.5 data.
AQI and PM 2.5 values are highly seasonal, with higher levels in cold winter months and lower levels during warmer months. Therefore, this research adjusts for seasonal variation by examining a particular day’s AQI or PM 2.5 value’s deviation from the monthly mean, which is calculated across all daily values in that particular month for all six years of the study. For example, all AQI and PM 2.5 values in any particular January in the study are subtracted by the average AQI or PM 2.5 value for all Januaries in the study. In this way, this paper examines the daily pollution level experienced relative to the average daily level in that particular month. If the policy changes aimed to reduce pollution is not effective, we would expect to see the daily deviations distributed randomly about the mean for each month, i.e. close to zero. However, if the policy is successful, then we would expect to see the deviations from the monthly mean decrease over time.
Independent and Control Variables
As discussed throughout the paper, the variable of interest is the policy implementation of the Ecological Environmental Protection Plan, made effective November 16th, 2016. This is a dummy variable taking on a value of 0 prior to the implementation of the policy and 1 thereafter.
The study controls for three other factors critical to air pollution levels in a city: maximum and minimum temperatures and wind speed. As noted above, lower temperatures induce greater levels of coal and wood burning for heat. As such, this research control for the daily minimum temperature in each of the cities. Though air conditioning units are not nearly as ubiquitous in homes in China as they are in the United States, they are nearly universally found in shopping areas throughout China and in homes in southern China. As such, this research also control for maximum daily temperature experienced in each of the cities. Higher temperatures are likely to elicit greater need for electricity and therefore an increased rate of burning coal to generate additional electricity to meet this increased demand. Both temperature measurements are measured in Celsius.
Wind scale refers to the speed of the wind, a major influencing factor of air quality since the wind scale affects the speed of diffusion of atmospheric pollutants. Conversely, the lower the wind speed, the more pollutants will accumulate in the city, resulting in bad air quality. Since there are different wind scales of each day, to unify variables, this research applied the highest wind scale of each day. Data for these variables comes also from the Ministry of Environmental Protection.
Research Strategy
To estimate the effects of the EPP Plan policy implementation on the air quality in Beijing we employ several strategies. First, we summarize the annual air pollution levels from 2014 to 2019. Then, due to seasonal weather variation, we conduct month-by-month comparison of means tests comparing the daily pre-policy deviations from the monthly mean for PM 2.5 and AQI levels with those of the post-policy levels. Next, we compare the annual average of daily deviations from the monthly mean for pre-policy levels against post-policy levels using a two-sample t-test. Last, to estimate the impact that the policy had on the average monthly deviations from the mean we conduct a two-level mixed-effect regression model controlling for effects at the monthly level.
Findings
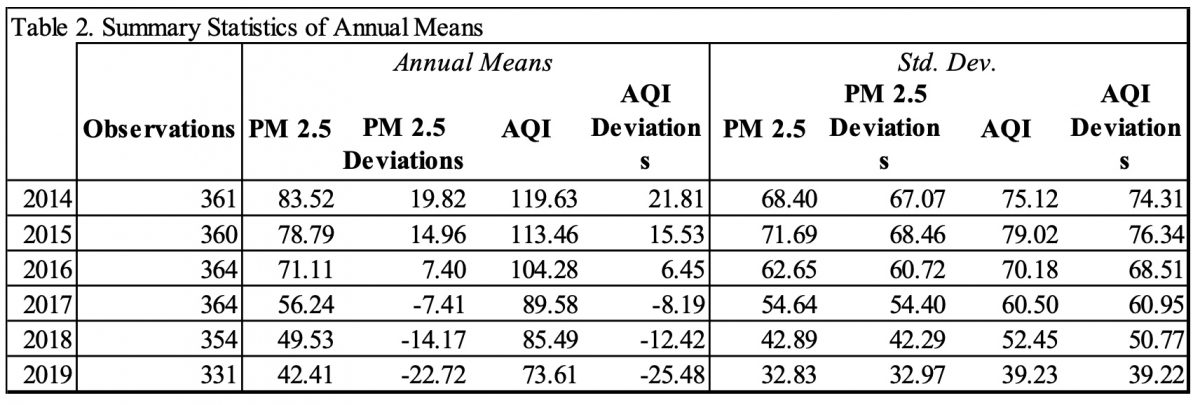
Table 2 displays the annual summary statistics of PM 2.5 and AQI level, as well as each indicator’s average daily deviation from the monthly mean. Consistently, from 2014 to 2019 levels for both air quality indicators and their daily deviations from the monthly mean decreased. In 2014, for example, PM 2.5 and AQI levels averaged 83.5 and 119.6 respectively. By 2019 they fell to 42.4 for PM 2.5 and 73.6 for AQI. Furthermore, we see that average daily deviations for both PM 2.5 and AQI consistently positive in all years prior to the policy, and negative in all years after the policy implantation. These trends suggest that the implantation of the EEP Plan policy may be improving air quality, and thus driving down PM 2.5 and AQI levels.
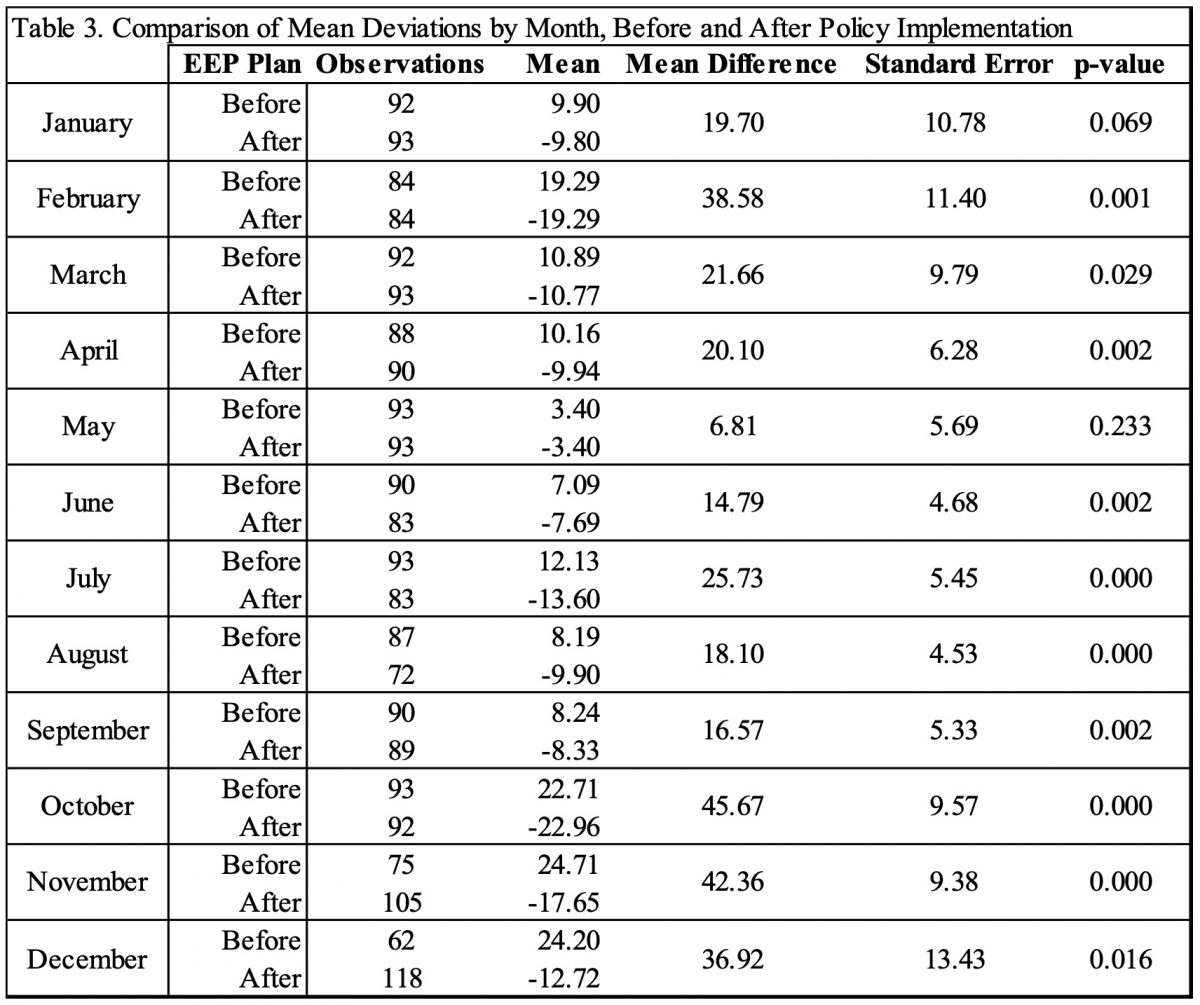
It is clear from the annual summary statistics of air quality in Beijing found in Table 2 that there have been improvements in the annual air quality levels. However, it is not clear if these differences were statistically different. Table 3, below, displays the results of difference of means tests comparing the mean daily PM 2.5 and the AQI deviations from the monthly means for each indicator. Tests are conducted month-by-month.
In all but two months of the year we found a significant difference between the pre-policy PM 2.5 deviation levels compared to post-policy levels. Post-policy levels were significantly lower throughout the year, except in the months of January (p<0.069) and May (p<0.23). The largest differences were found in the months of October and November, with mean differences of 45.7 and 42.4, respectively, of PM 2.5 deviations from monthly mean after policy implementation. The smallest differences were found in the months of May and June, with mean PM 2.5 deviation differences of 6.8 and 14.8, respectively. Results for AQI deviations from the monthly mean are nearly identical, with the exception that there was no significant difference between pre/post-policy levels in the month of June.
We then tested the average daily deviations from the monthly mean pre-policy implementation to the average daily deviations post-policy. Table 4 shows that both annual means of PM 2.5 and AQI daily deviation from the monthly mean are significantly different, with post-policy implementation being, on average, 25 PM 2.5 points and 24 AQI points lower than the monthly mean compared to pre-policy levels.
The results from the comparison of means tests lead us to reject the null hypothesis in support of our first hypothesis. From the data we see that there is a significant difference between air quality levels in Beijing prior to policy implementation compared to after its implementation. However, we cannot determine the size of the impact that the policy has on reducing PM 2.5 and AQI levels. Furthermore, we cannot rule out outside factors such as wind rating and temperature as alternative explanations unless we control for those factors. To do that, and test the second hypothesis, we conduct two-level mixed-effect regression models.
In order to measure the effects of the EEP plan policy implementation on Beijing, while controlling for other factors, a two-level mixed effect model is introduced. In these models, monthly means are analyzed from the aggregated daily data. Models for both PM 2.5 and AQI are presented with results shown in Table 4.
Auto-correlation presents a potential problem for longitudinal data. As such, both models adopt a one-month lag to correct for this auto-correlation. The need for this was diagnosed two ways. First, a linear regression was run with three covariates, policy implementation, minimum temperature, and wind scale. From these regressions, the Durbin-Watson statistic indicated positive auto-correlation. Second, using the Cumby-Huizinga test, auto-correlation was found to be significantly present at the first lag. As such, these models adopt one lag for the two-level mixed-effect regression.
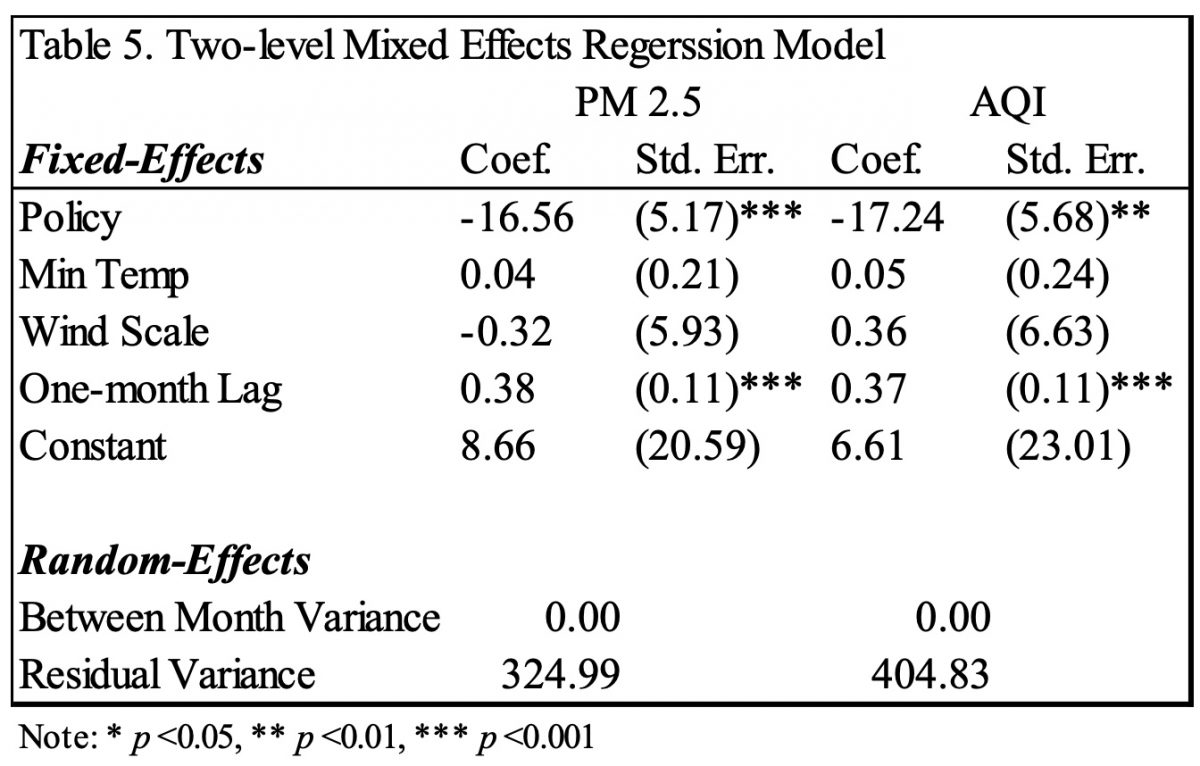
The results of the mixed-effect regressions for both PM 2.5 and AQI are strikingly similar, regardless of whether minimum temperature or maximum temperature is included in the model, lending support to the robustness of the model. In the interest of brevity, results are reported for PM 2.5 with maximum temperature included in the model. From Table 5 below, we see that implementation of the policy accounts for, on average, a 16.7 point reduction of PM 2.5 levels in each month. This is significant at the p<.001 level, providing evidence in support of the second hypothesis. Additionally, temperature and wind scale are not significantly related to mean monthly reductions in air quality. The residual variation among the months is 325 points for PM 2.5 and 405 points for AQI mean monthly deviations.
Implications
From these findings we take away several key points. First, Beijing’s air quality has significantly improved post-policy implementation compared to pre-policy implementation in ten out of twelve months of the year, both in terms of PM 2.5 and AQI. In all twelve months, both indicators’ daily levels were, on average, lower than their monthly mean after the EEP Plan was implemented, while, in contrast, both indicators were, on average, greater than their monthly mean for all twelve months prior to policy implementation.
The greatest improvements in air quality were experienced in the five coolest months, October through February. The average difference in air quality levels from pre- to post-policy implementation was 37 points lower in those months compared to 17.7 points lower for the remaining seven months. That is to say that the policy was most effective in improving air quality during the colder months. However, there were several months in the post-policy implementation period that maximum temperatures were significantly warmer when compared to the same months in the pre-policy implementation years. For instance, the months of May, June and September were 1.2 to 1.8 degrees Celsius warmer. Furthermore, minimum temperatures were significantly cooler in October and November after policy implementation by 1.3 to 1.6 degrees. The minimum temperature in July was significantly warmer post-policy implementation by 1.1 degrees Celsius. There were no other significant differences in temperature among the remaining months. In short, despite significantly colder temperatures in some of the winter months, and warmer temperatures in July, the post-policy implementation period experienced improved air quality.
Second, the data suggests that with careful policy implementation China’s leaders can improve its air quality around the country. Beijing is China’s second largest city and perennially ranked as one of the top 200 most polluted cities in the world. If policy makers can implement strategies to clear up Beijing’s air, they will have a model that they can use in similarly situated cities.
Last, China’s success is the world’s success. Successful policies that are effective at cleaning up China’s air will improve air quality for China’s regional neighbors on the Korean Peninsula, and to a lesser degree Taiwan and Japan. Additionally, China will contribute a smaller share of the global greenhouse emissions and serve as a model to other developing countries, such as India, that effective environmental management is not simply a chimera, but is indeed attainable.


Further Reading on E-International Relations
No comments:
Post a Comment