 In the last three years, tensions among major powers have escalated, with China involved, willingly or otherwise, in several episodes. These include the trade war with the United States, border frictions with India, maritime issues with several Southeast Asian countries in the South China Sea, industrial espionage accusations involving Huawei, the U.K. and other Western countries’ reaction to the national security law in Hong Kong, and more recently controversy surrounding the origins of the novel coronavirus.
Who are China’s foes? To what extent can China rely on its friends? Given the importance of the international sector in the Chinese economy, these are important questions to consider. Trade sanctions, as in the past, can be used to punish China. If such sanctions are carried out, to what extent will China’s international trade be affected?
We took the 26 major trading partners, which make up 80 percent of China’s total trade, and then excluded Taiwan due to data inconsistency and Hong Kong due to Chinese goods being re-exported from the city. We classified the remaining 24 countries based on their relationship with China using big data. We counted the number of articles in the Financial Times and South China Morning Post, over the period of January to June 2020, that contained negative sentiments such as “tension,” “disagreement,” “dispute,” “accusation,” and “war” involving China and its trading partners. We categories the countries with the largest of negative connotations as “red” while the green countries are those with the least. The yellow ones are those around the average.
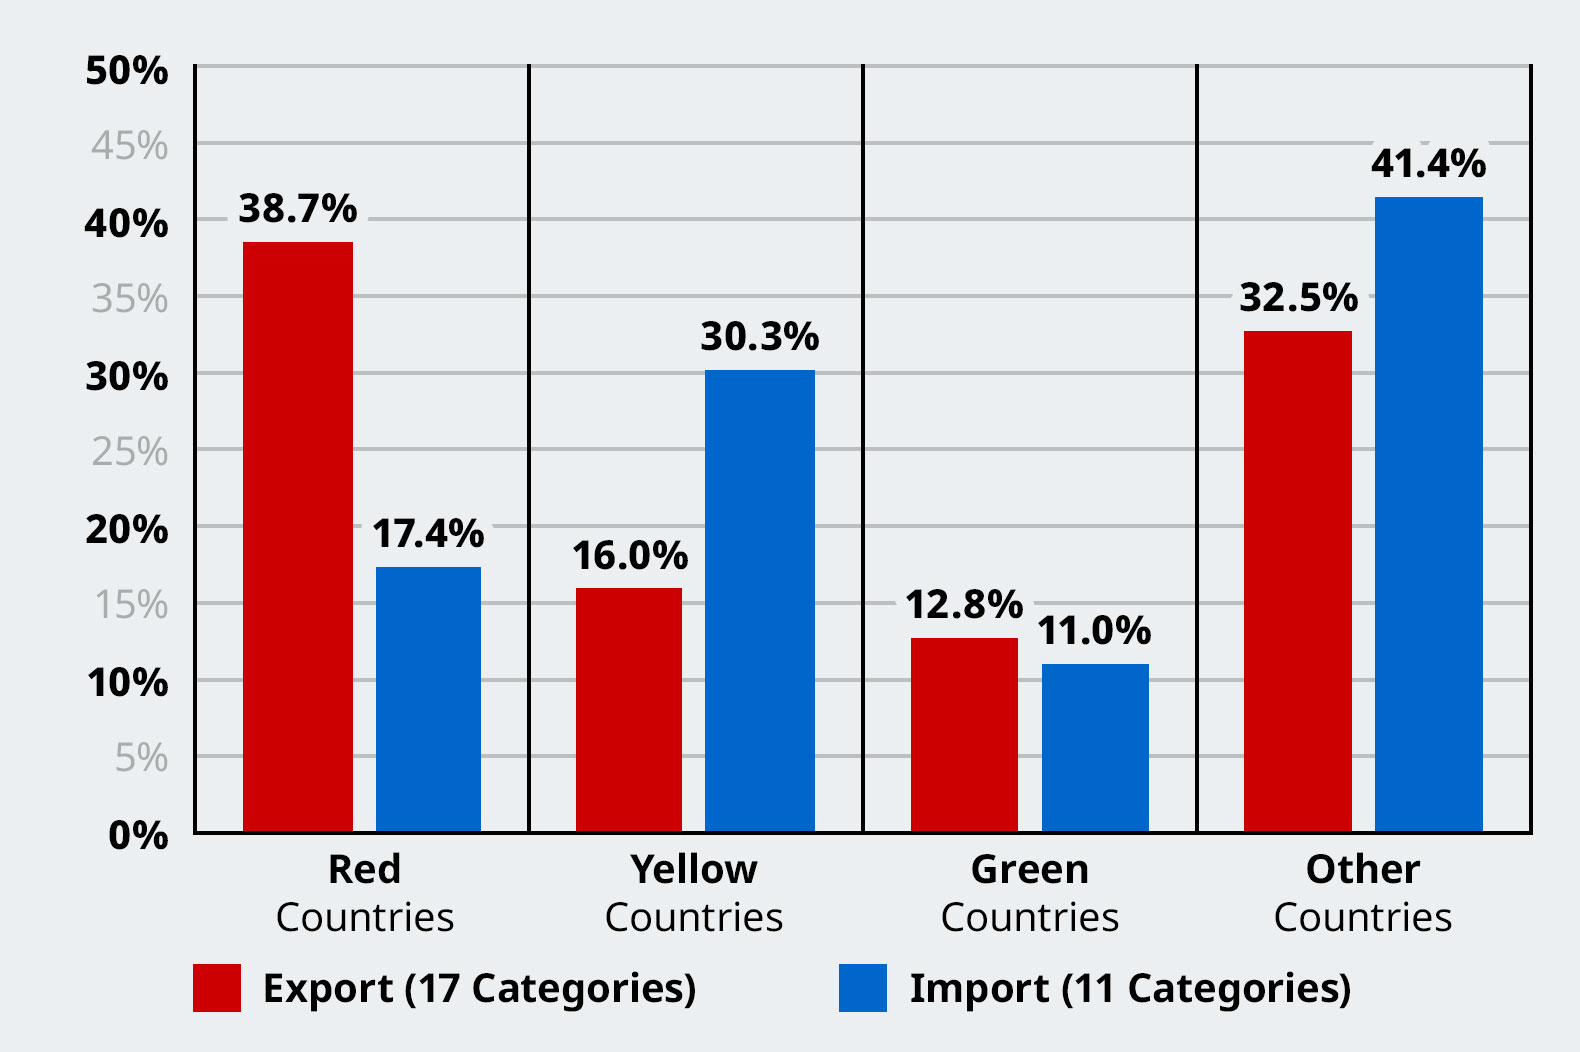
Red countries – the United States, Japan, Germany, Russia, India, and the U.K. – make up 30 percent of China’s total trade.
Yellow countries – South Korea, Australia, Vietnam, Brazil, Singapore, Saudi Arabia, France, Canada, and Italy – account for 24 percent of China’s total trade.
Green countries – Malaysia, Thailand, the Netherlands, Indonesia, Mexico, the Philippines, the UAE, South Africa, and Chile – accounts for 14 percent of total trade.
(While one could argue that a given country should belong to another category, we were data driven in our classification, using the methodology outlined above.)

Next, we evaluated China’s exports and imports to these country groupings. Eleven product categories make up half of China’s total imports and 17 product categories for half of China’s total exports. On average, China imports about 17 percent of these products from the red countries, while 30 percent and 11 percent of imports come from the yellow and green countries, respectively. China on average exports 39 percent of these items to the red countries, but only 16 percent and 13 percent to the yellow and green countries, respectively. In other words, when it comes to imports, the yellow and green countries are significantly more important. The red countries are important export destinations.
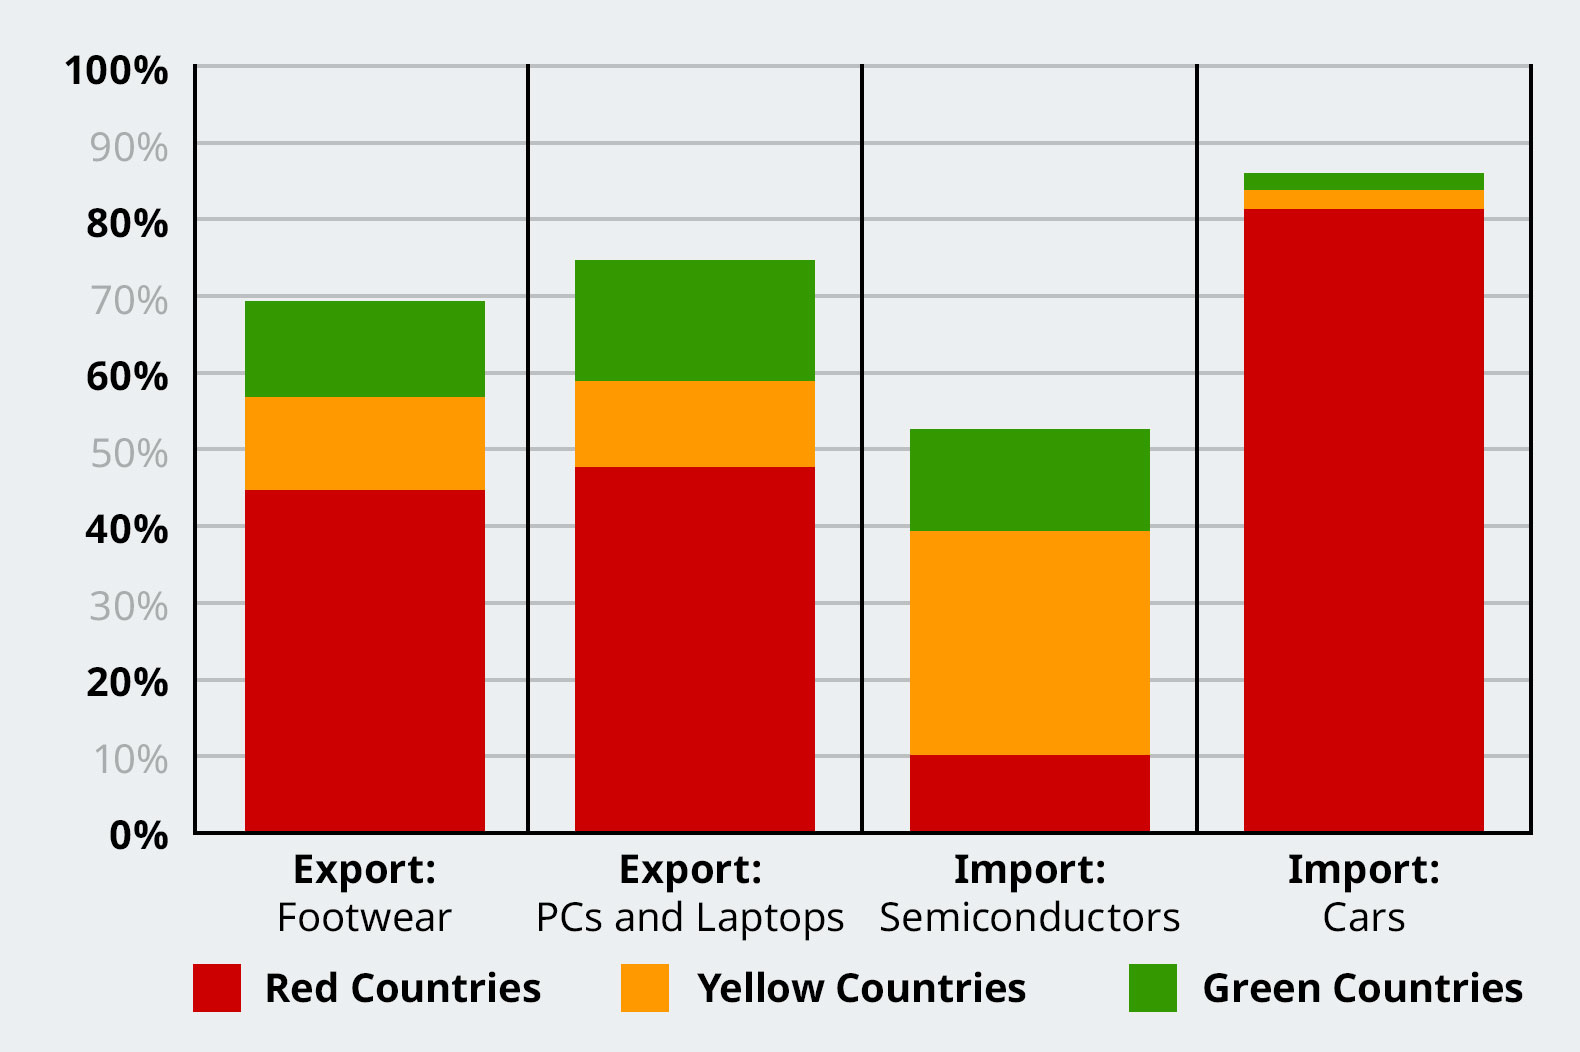
Major imported products include semiconductors, crude petroleum, computer components, iron ore, natural gas, and cars. The yellow countries have the capability to supply China, because their exports to the rest of the world are several times higher than China’s imports from the red countries. Take for instance, semiconductors. About 10.6 percent of China’s imports of semiconductors are from the red countries, compared to 29.1 percent from yellow countries and 13.2 percent from green countries. The exports of the yellow and green countries to the rest of the world are nearly 4 and 1.6 times that of China’s imports from the red countries, respectively. For cars, however, nearly 82 percent of China’s imports come from the red countries. Although the yellow and green countries have the market capacity, it would be difficult for China to reallocate 80 percent of its demand swiftly.

China’s exports are mainly in machinery and transportation equipment as well as apparel. Take for instance, PCs and laptops. More than 48 percent of China’s exports of this product category go to the red countries while only 11.2 percent and 15.7 percent are sent to the yellow and green countries, respectively. Another good example is footwear. About 45 percent of China’s exports of footwear go to the red countries while only 12.1 percent and 12.4 percent go to the yellow and green countries respectively. In both these examples, when compared to the total imports of these items from the rest of the world, the yellow and green countries do not have the capability to absorb China’s exports. Only after combing the market size of the yellow and green countries can these countries absorb 10 of the 17 product categories.
The above analysis implies the following: First, being involved in international relations tension with several countries at the same time is never a good idea. In the case of China, the current feud with the United States and the uncomfortable relationships with the U.K., Japan, India, and Australia, all add up to be a little too much from an international economics perspective. Second, China needs strong international relations with the EU in the west and ASEAN in the south. Members of these two economic blocs are prominent among the yellow countries in our classification above, particularly Vietnam, Singapore, France, and Italy. The China-Europe and China-Southeast Asia relationships go back centuries, and it would not be sensible to allow those relationships to be tainted. Third, since China’s exports would be more affected by these tensions compared to imports, the power of cranking up the domestic market for items like PCs, laptops, footwear, and cars should never be underestimated. If there is any one market that can replace the markets of the red countries, it will be the China market itself.
Dr. Bala Ramasamy is professor of economics and associate dean at China Europe International Business School (CEIBS).
Dr. Wu Howei is a lecturer of economics at CEIBS.
Dr. Matthew Yeung is an associate professor at Lee Shau Kee School of Business and Administration of the Open University of Hong Kong.
No comments:
Post a Comment