By Jonathan Moyer, Tim Sweijs, Matthew Burrows and Hugo Van Manen for Atlantic Council
 In this article, Jonathan Moyer et al highlight insights drawn from the Formal Bilateral Influence Capacity (FBIC) Index, which measures the bilateral influence of states from 1963 to the present. Key findings include 1) similar to trends in the global distribution of power, global influence is dispersing; 2) US’ global influence is declining and is considerably smaller than its share of the world’s coercive capabilities; 3) China’s has vastly expanded its influence, while Russia has seen a considerable decline; 4) European states significantly punch above their weight relative to their economies, and more.
We have known for many years that globalization is changing the meaning of power, but it has been difficult to define that shift, let alone quantify it. It is not just material capabilities—such as gross domestic product (GDP) or defense expenditures—that constitute a country’s power. How well a country is positioned to influence others through economic trade, military transfers, and membership in regional and global institutions is also an important source of power. This pathbreaking paper takes on the challenge of showing us the way to measure influence and how different countries’ influence has increased or decreased since 1963. Formerly, analysts only had rough measures as GDP or defense expenditures for gauging how much better or worse a country was doing relative to the rest of the international community. The Foreign Bilateral Influence Capacity (FBIC) Index, introduced by this paper, maps for the first time the rise and fall of influence for key countries.
No one is arguing that material capacities are not and will not remain very important to a country’s power, particularly now that geopolitics has returned. But how well a country is positioned to influence another also is a key factor. The twentieth century was the American century, not just because the United States was the victor in the two world wars but also because much of the rest of the world was persuaded to adopt such traditional American values as capitalism and democracy.
Worrisome are the findings for today’s United States. The United States still retains a lead in global influence, but its share has been decreasing and is considerably smaller than its share of coercive capabilities. It will come as no surprise that China has been the big winner in the past decade, vastly expanding its influence as its economic power increases. But what is not always appreciated is that China’s influence is no longer concentrated in its region. China’s influence surpassed the United States in Africa 2013, as measured by the FBIC Index. The United States and China are the two powers with the largest global reach in terms of influence. But many European states punch above their weight by comparison to the size of their economies.
This is not the first time that I have partnered with the University of Denver’s Pardee Center for International Futures. While I was the counselor at the US National Intelligence Council (2003-2013) responsible for producing three editions of the highly rated Global Trends report,1 the Pardee Center was critical for the modeling of those trends. More recently, after retiring and moving to the Atlantic Council, I partnered again with the Pardee Center to produce three joint reports on cyber,2 demographic,3 and geopolitic risk4 ponsored
by Zurich Insurance. I am pleased that we could once again collaborate on such a thought-provoking way of analyzing power in the twenty-first century. I am also pleased to team up with the The Hague Centre for Strategic Studies, which I know from their important role in futures work on the other side of the Atlantic. The collaboration between our three institutions, I dare say, showcases once again the added value that strong transatlantic partnerships can yield.
Executive Summary
Today the ability to get other states to act in the international system may be characterized more by formal networks of influence than by traditional measures of coercive material capabilities. Yet, the concept of coercive power, rather than influence, continues to be central both in scholarly and political discourses about international order and the ability of nation states to promote and protect critical national interests. The lack of a clear but also measurable concept of what influence is and what tangible benefits accrue from it may be partly to blame for this.
In filling that void, this report presents the highlights of our analysis of the newly compiled Formal Bilateral Influence Capacity (FBIC) Index. The FBIC Index contains bilateral measures of the formal economic, political, and security influence capacity of states worldwide from 1963 to 2016. Our analysis maps the changing dynamics of state influence over time. Key findings from this report include the following:
Global influence is concentrated in the hands of the few. Only ten countries possess about half of the world’s influence.
Similar to trends in the global distribution of power, global influence has been dispersing. A growing number of states wield greater amounts of influence over larger geographical distances.
The United States still retains a global lead in terms of its share of global influence capacity, but its share has been decreasing and is considerably smaller than its share of the world’s coercive capabilities.
China’s upward trajectory has been impressive. It has vastly expanded its influence, not only in its own region but also outside of it, including in NATO member states and in Africa at large, where it has surpassed the United States.
Russia’s trajectory has been similarly sizeable, but in the opposite direction: it has lost considerable amounts of influence, including in countries in the former Soviet space.
European states, including some small ones such as the Netherlands, significantly punch above their weight in comparison to the size of their economies.
Great powers continue to vie over spheres of influence for a variety of military-strategic, economic, and ideological reasons. Pivot states are located in the Middle East, Central Asia, Southeast Asia, Latin America, and West Africa.
The past two decades saw the emergence of new networks of influence and the reconfiguration of others around dominant hubs including in the Middle East and China.
Table 1 shows the top ten countries in 2016 for three measures of power and influence. The Foreign Bilateral Influence Capacity (FBIC) Index is introduced in this report and measures multidimensional relational influence bilaterally. The Global Power Index (GPI) (featured in recent Global Trends reports produced by the National Intelligence Community) measures multidimensional institutional, economic, material, and technological military capabilities nationally. Gross Domestic Product (GDP) at Market Exchange Rates is the sum of all final goods and services produced domestically and is often used as a proxy for national capabilities.
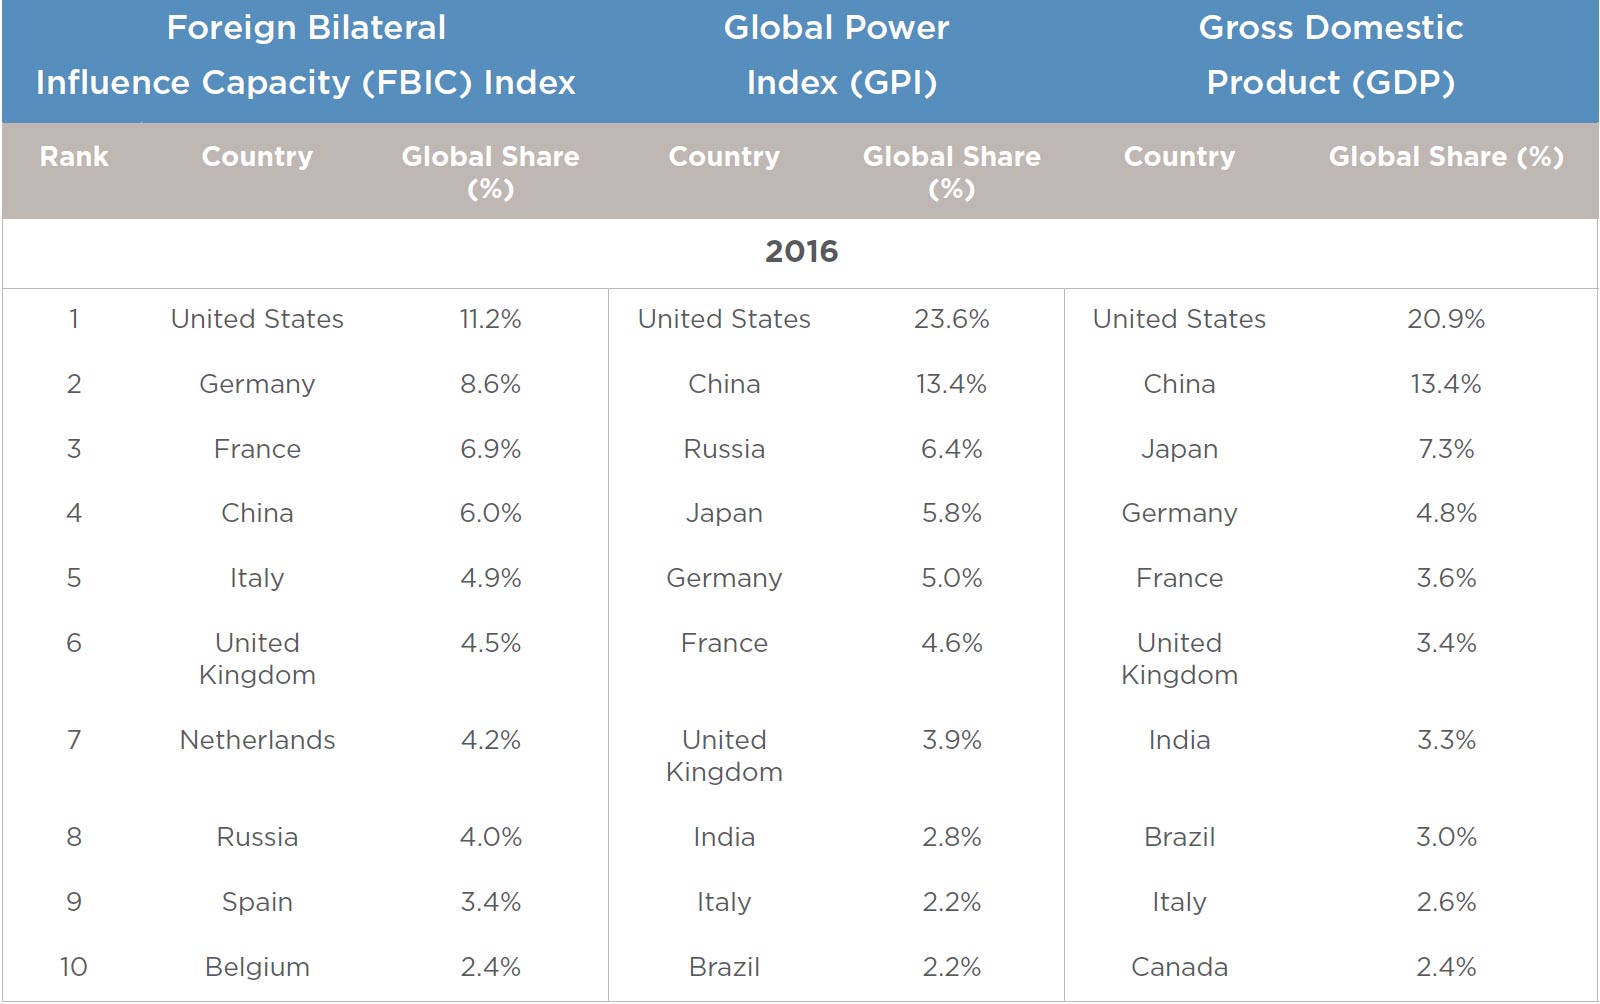
Table 1: Top 10 countries for three measures of influence—FBIC Index, GPI, GDP, 2016
Introduction
Policymakers, pundits, and scholars (with the exception, perhaps, of a few hard-core realists), widely acknowledge that power and influence are derived from more than just coercive military capabilities, but are exercised through networks of economic, political, and security interactions involving states as well as non-state actors. Influential states are able to effectively deploy a broader portfolio of instruments- of-influence to modify the beliefs and/or the behavior of other states. It is this ability that lies at the heart of effective statecraft—one that protects and promotes national interests—in today’s globalized world.
Despite the growing importance of relational power, the budgets of State Departments and Foreign Services of countries on both sides of the Atlantic have received substantial cuts these past few years. The Trump Administration’s budget for Fiscal Year 2018 includes plans to decrease the State Department’s budget by 30 percent. Departments of key European countries such as France and the United Kingdom have also been severely downsized in the aftermath of the Great Recession.5 These cuts are not only about the need to ‘balance-the-budget,’ but take place in the context of the wave of populist pro-sovereignty that has swept the political landscape of Western democracies in recent years. The concomitant societal backlash against globalization is further fueling political support to ‘take back national control’ and withdraw from international participation, as was clearly captured by Brexit and Trump’s America First doctrine. Whether the rise of this movement was caused by the ‘liberal order’ being ‘rigged,’6 or resulted from the failure of political leaders to properly explain the benefits of international participation to their constituencies, is a question we will not concern ourselves with here.7
Conspicuously absent in popular and scholarly debates is an understanding of what international influence is. Beyond anecdotal evidence or broad brushed descriptions of the utility of ‘soft,’ ‘smart,’ or ‘civilian’ power, there is simply neither a clear concept nor a systematic measurement of international influence derived from relational dependence.8 This lack of clear conceptualization drives a gap in measurement.
In this report, we seek to fill some of this conceptual and empirical gap. We present a set of highlights from the results of an in-depth analysis of a newly created dataset called the Foreign Bilateral Influence Capacity (FBIC) Index that measures the bilateral influence of states. The FBIC Index includes forty-two economic, political, and security indicators with over 200 million individual observations from 1963 to the present. The multidimensional, dyadic measurement of influence makes it possible to conduct a broader analysis of different aspects of international relations than traditional power, resource-based approaches.
Using the FBIC Index, we identify the key influencers in the international system and analyze the states that punch above their weight and those that punch below. We trace the rise of China, the long trajectory of decline of some European states, as well as the surprisingly strong performance of others, and we reflect on the very different positions of the United States and Russia in all of this. We expose regional spheres of influence and pay attention to the contested zones in the international system and the pivot states that reside there. Finally, we look at networks of influence in the international system and discuss their evolution over time.
With this report, we aspire to do more than just infuse foreign policy debates about the United States’ and Europe’s standing in the world with much needed conceptual and empirical clarity. We seek to bridge that gap between quantitative policy analysis and real-world policymaking, and we outline, if only preliminarily, what we consider quintessential elements of a grand strategy aimed at enlarging influence to protect and promote critical national security interests.
This report is structured as follows: it first defines the concept of influence in the FBIC Index with reference to the literature on power and influence and explains the methodological fundamentals of the Index’s construction. (The thirty-page annex to this report offers more detail.) It then turns to the empirical analysis along the lines just described, and it concludes with an assessment of the implications of our findings.
Conceptualizing Influence
The concepts of influence and power both feature prominently in international relations literature,9 but extant scholarship often fails to coherently distinguish them from one another.10 We conceptualize influence as a broader concept than power in international relations. The following section outlines our conceptual framing for the concept of influence in the international system.
In introducing our concept of influence, it is useful to distinguish and briefly discuss three schools of thought. The first views influence and power as synonymous and posits that the two concepts are indistinguishable.11 This perspective, originally spearheaded by Max Weber, views power and influence alike as objects exercised over “other persons”12—these are “the ability of an individual or group to achieve their own goals or aims when others are trying to prevent them from realizing them.”13 Prominent power theorists such as Robert A. Dahl, Steven Lukes, and David A. Baldwin have taken up this view, arguing that the concepts of influence and power simply refer to actor A’s capacity to get actor B to “do something that B would not otherwise do,”14 and that the concepts of influence and power can be used “interchangeably.”15
A second school of thought aligns with the first in its conceptualization of influence as a change which actor A brings about in actor B. However it differs in its view that power—far from being synonymous with influence—is a concept that denotes actor A’s ability to influence actor B.16 In this view, power is something which can be possessed while influence is something that can be exerted. Realist authors such as Hans Morgenthau and Kenneth N. Waltz hold this view and posit that a nation’s material capabilities play a key role in the state’s ability to modify the behavior of its peers.17
Finally, a third school of thought, which is adhered to by the FBIC Index, conceptualizes influence as a force that transforms into power when actor A actively (and successfully) utilizes it to modify the behavior of actor B. It posits that the relationship between power and influence is best captured as a hierarchy in which influence is the general concept, and power is the conscious manifestation of influence.18 It subscribes to the notion that an actor can possess influence by presiding over sources (whether natural, military, or relational), but contends that it does not hold power unless it has the capacity to successfully field its sources of influence towards achieving desired outcomes.19 This sentiment is clearly expressed by Dennis H. Wrong, who states that if actor A succeeds in altering actor B’s behavior “in the desired direction, then he clearly has power over B.”20
The exercise of influence results from an unspoken understanding (or promise) that state A can cut off state B if it fails to comply. Implicit influence may also manifest itself through co-optive means. In these cases, it derives from state attractiveness. State attractiveness is understood as a source of co-optive influence which compels third parties to go along with one another’s purposes “without any explicit threat or exchange taking place.” Because state B’s perception of state A’s “attractiveness” is dependent on a host of state-specific variables (e.g., its history with state A, culture of state B, etc.), it can be argued that ideational power—like its resource-based counterpart—also remains subject to relational context.
Because of the array of potential types of influence and its context specificity, the concept of influence is best expressed in terms of state A’s potential capacity to influence state B rather than through the analysis of actual outcomes. This is because state influence— though it may be exerted intentionally—can also lead to change that is “neither actively pursued nor beneficial to” the influencer,21 and partially because influence does not produce outputs which can be easily measured (or attributed) to actors at the dyadic level.
The FBIC Index facilitates a multidimensional understanding of influence in which both access to national resources and relational context are treated.22 This approach differs from other methods that rely on a resource-based model for measuring capacity to bring about change in other actors.23 The multidimensional approach posits that state influence derives partially from discrepancies in access to national resources24 and partially from relationally contextual factors, which, when combined, denote how effectively either side can leverage the national resources at its disposal to influence the other.25
In the context of interstate relations, we submit that influence derives from a combination of state access to national resources, and from relational, context-specific dynamics between countries A and B, including state attractiveness. National resources include economic, political, and security means. Within a dyad, asymmetrical access to these resources causes imbalances in dependency. Such imbalances allow state A to exert influence over state B both explicitly and implicitly. In cases where imbalances lead to influence being exerted explicitly, state A’s relative independence allows it to coerce state B because state A can credibly threaten to withhold from state B resources on which it depends. The implicit exercise of influence derives from the same dynamic, but results from an unspoken understanding (or promise) that state A can cut off state B if it fails to comply with unspoken wishes.
Measuring Influence: The FBIC Index
The Foreign Bilateral Influence Capacity (FBIC) Index is built upon the idea that two main factors affect the ability of states to exert influence in the international system. First, the extent of interaction across economic, political, and security dimensions creates opportunities for states to influence each other. Second, the relative dependence of one state on another for crucial aspects of economic prosperity or security creates opportunities for the more dominant state to cause the more dependent state to make decisions that they would not have otherwise made. We call these two sub-indices Bandwidth and Dependence.26
Bandwidth and Dependence
The Bandwidth sub-index measures the extent of the connection between two countries reflected in the volume of shared economic, political, and security interactions. All components of the Bandwidth subindex are shared, absolute measures that represent the size and number of connection points between two states. One way of thinking about this is as the “size of the pipeline” of potential influence through which a country can then direct actual influence towards another country. As the size of cross-border flows increases, so does the size of the pipeline that both states can use to potentially direct influence. The value of the Bandwidth sub-index is symmetrical, so in each year the value from country A to country B will always equal country B to country A. For example, total trade between countries A and B is one of our bandwidth indicators. For this sub-indicator the value for a given dyad in a given year will be the same whether a given state is considered country A or country B (this is not true for the next sub-indicator). See Table 2 for a description of the data sources used in the FBIC Index.
The Dependence sub-index measures the “strength of the flow in each direction” or the degree to which an ‘influencee’ relies on an influencer for crucial economic and security assets. We have not included any political indicators in the Dependence sub-index because our data does not include asymmetric political connections. The Dependence sub-index operationalizes relative indicators to measure the reliance one country in the dyad has on the other.
The contrast between Bandwidth and Dependence is expanded upon in Table 3.
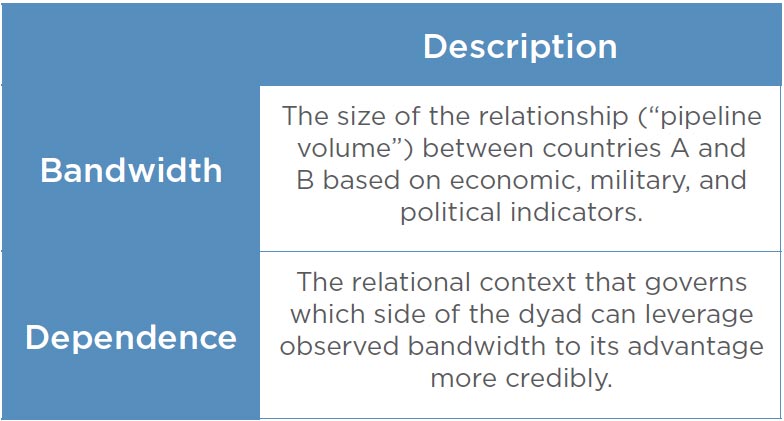
Table 2: Data sources used in the FBIC Index
This sub-index has two components: 1) the importance of a flow relative to that total inflow for a country and 2) the importance of a flow relative to the aggregate economic or military capacity of the country. Let us explain that by going back to the trade example. The first component of the Dependence sub-index is the share of the overall trade volume of country B that occurs with country A. This is an important element of influence: if most of country A’s external trade is with country B, it is quite dependent on it in as far as its trade is concerned. But that indicator alone does not tell the full story. If trade represents only a very small part of country A’s GDP, then even a very high relative trade dependence (in percent of trade terms) would yield less influence capacity than if its economy were highly integrated in the global trading network.
This is why measures of economy and military size are included in our dependence scores. For the economic components of our Dependence measure, we utilize gross domestic product; for the security components we use military spending. The sub-index Dependence is directed, or asymmetric, so the value of country A to country B is different than the value from country B to country A.

Table 3: FBIC Index taxonomy and variables
The FBIC Index is calculated by taking the product of the Bandwidth and Dependence sub-indices; a combination of the magnitude of shared ties and the degree of dependency among the dyad. Each subcomponent in the FBIC Index is weighted. The distribution of weights is shown in Figures 1 and 2. The weights were derived from our conceptual understanding of influence and power discussed in the literature review and calibrated according to the results of a survey given to international relations experts.
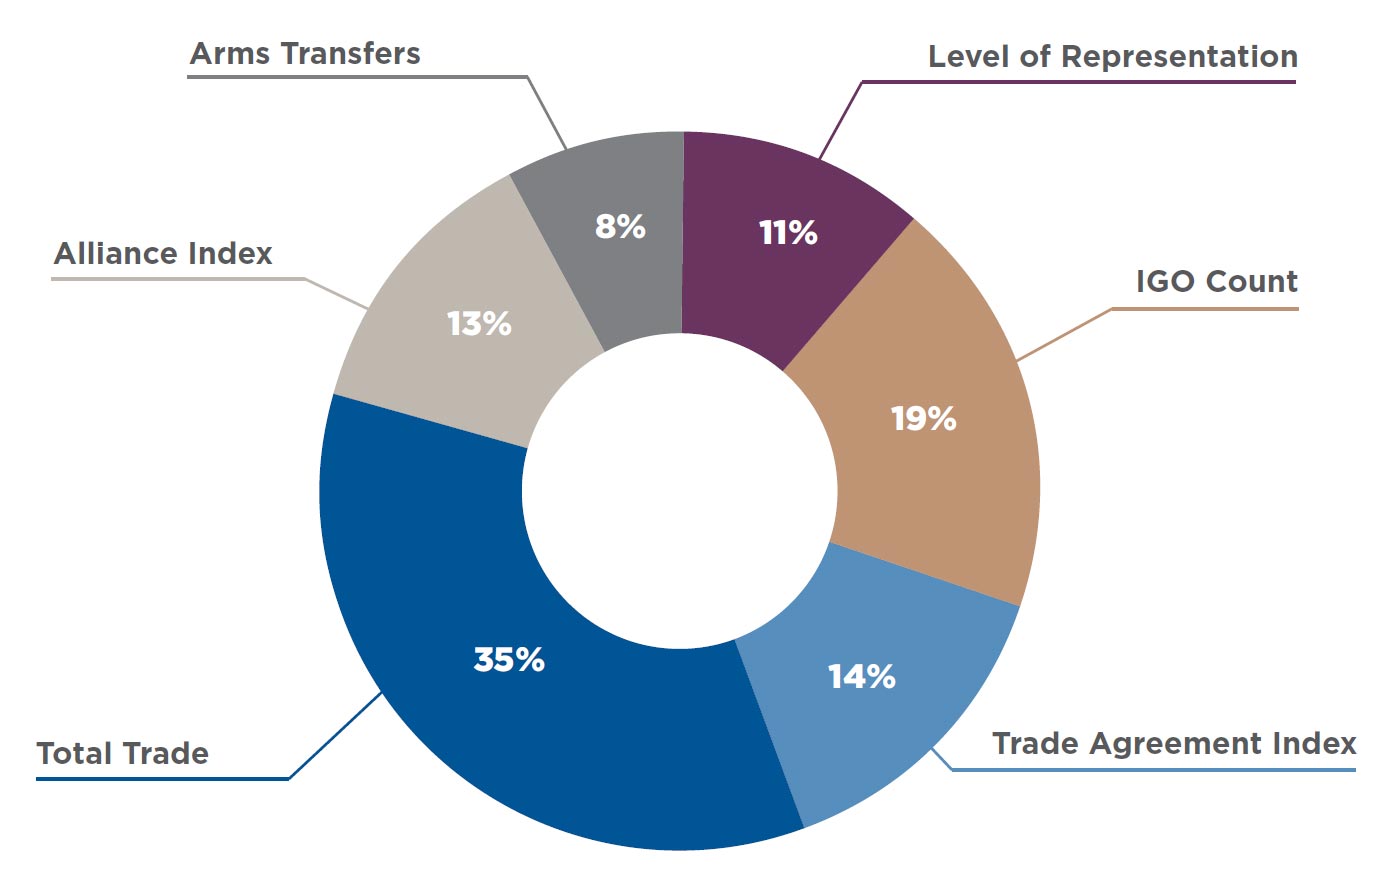
Figure 1: Weighting of sub-components of Bandwidth in FBIC Index
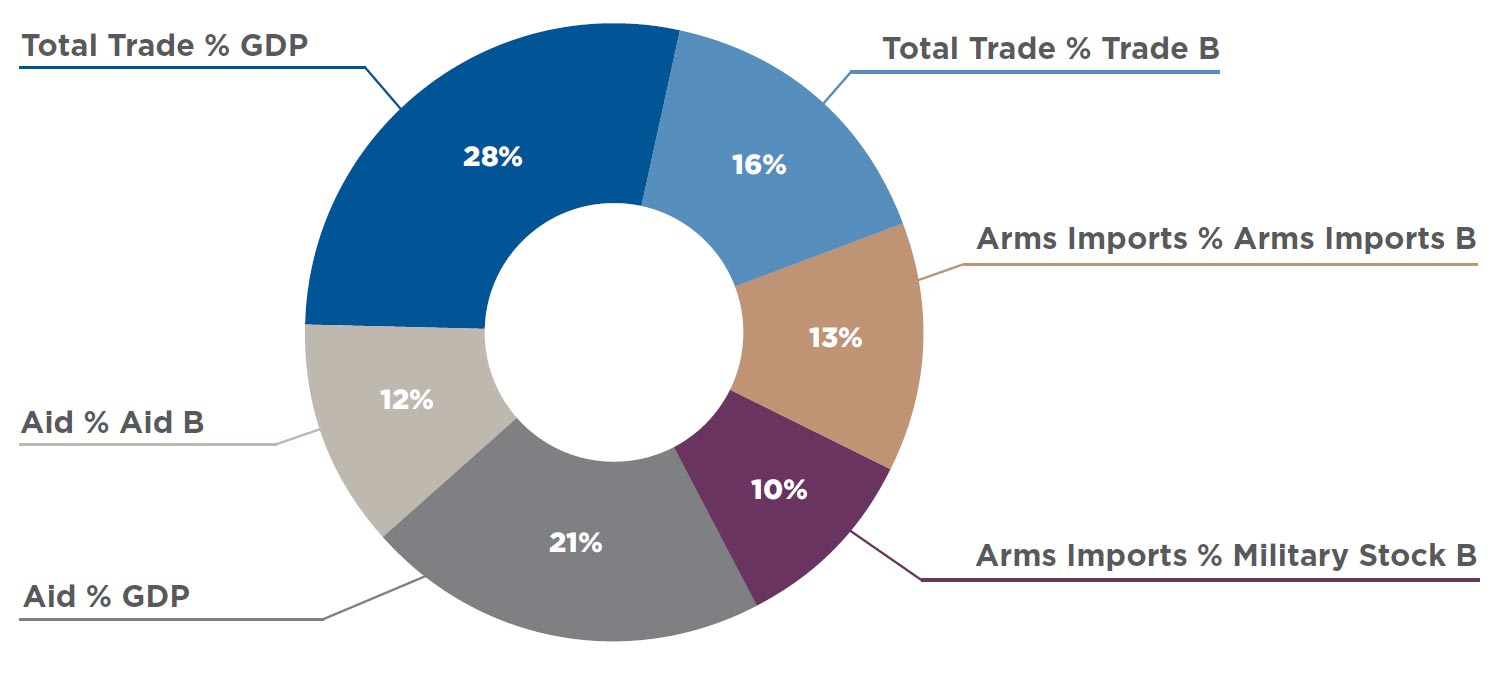
Figure 2: Weighting of sub-components of Dependence in FBIC Index
These data also focus on formal bilateral influence capacity, not on covert influence. There has been much debate recently about the impact of hybrid activities and foreign societal interference (for example, aimed at influencing elections). While these covert actions have substantial material impacts, we consider the formal mechanisms of relational influence to be fundamental drivers of foreign policy interactions. In addition, other important aspects of bilateral decision-making are not captured here. The quality of a country’s leadership matters. Leaders can change dynamics within structural constraints. They can create new patterns of dependence and influence (e.g., Nixon opening to China), amplify and draw upon patterns of relational influence (e.g., Bush forming the Coalition of the Willing to invade Iraq), or otherwise change the character of the system outside of what is measured here. As with all quantitative measures, their use should be complemented with alternative methods and perspectives to develop mature evidence-based perspectives on the events of the day.
The FBIC Index is unique in operationalizing influence and complex interdependence at the dyadic level. Many other scholars and researchers have measured the relative power of states to achieve outcomes in the international system, though these approaches tend to be largely reducible to material capabilities. One approach measures power across multiple dimensions to create a country-year score. Examples include the Global Power Index (GPI),27 the Composite Index of National Capabilities (CINC) of the Correlates of War project,28 and the Global Firepower Index.29 These indices can be criticized for employing a largely resource-based approach to measuring state capacity.30 Because these indices do not account for relational context, the FBIC Index provides new insights into state A’s ability to modify the behavior of state B. This utility stems partly from its two-way measurement of influence within dyads over time and partly from its subscription to a multidimensional operationalization of the phenomenon, which (to our knowledge) constitutes a new contribution to the field of international relations analysis.
The Distribution of global Influence: Trends and Patterns
Globally, influence is concentrated in the hands of the few, with only ten countries in possession of about half of the world’s influence. Today the United States possesses 11 percent of global influence. Germany and France follow with about 9 percent and 7 percent respectively. China is ranked fourth and exerts about 6 percent of global influence. Broadly speaking, members of the European Union perform well in the FBIC Index due to their high levels of continental interdependence. Such states account for five of the seven remaining top ten countries: Italy, United Kingdom, the Netherlands, Spain, and Belgium. Russia rounds out the list and is ranked eighth with 4 percent of world influence.
Much has been written about the increasingly interconnected international system resulting from decades of globalization. States today exert greater influence on other states and on a greater number of states. The total flow of economic, political, and security relationships—as expressed by Bandwidth— has grown by about 350 percent since the early 1960s, accounting for much of the increase in global influence networks. But while the magnitude of the relationships between states has increased the opportunities to exert influence, the average level of Dependence between states has not changed significantly. This is partially due to the fact that the increase in the number of states in the international system—from 119 in 1963 to 195 in 201631—has diluted the growth in Dependence across highly connected states.
Of the various sub-dimensions, economic influence has grown significantly since the end of the Cold War. The political and security sub-dimensions have seen less growth. Security influence increased substantially during the Cold War, and again immediately after the fall of the Soviet Union, only to plateau starting at the beginning of the twenty-first century. Influence measured through the political sub-dimensions has accumulated incrementally throughout this period.
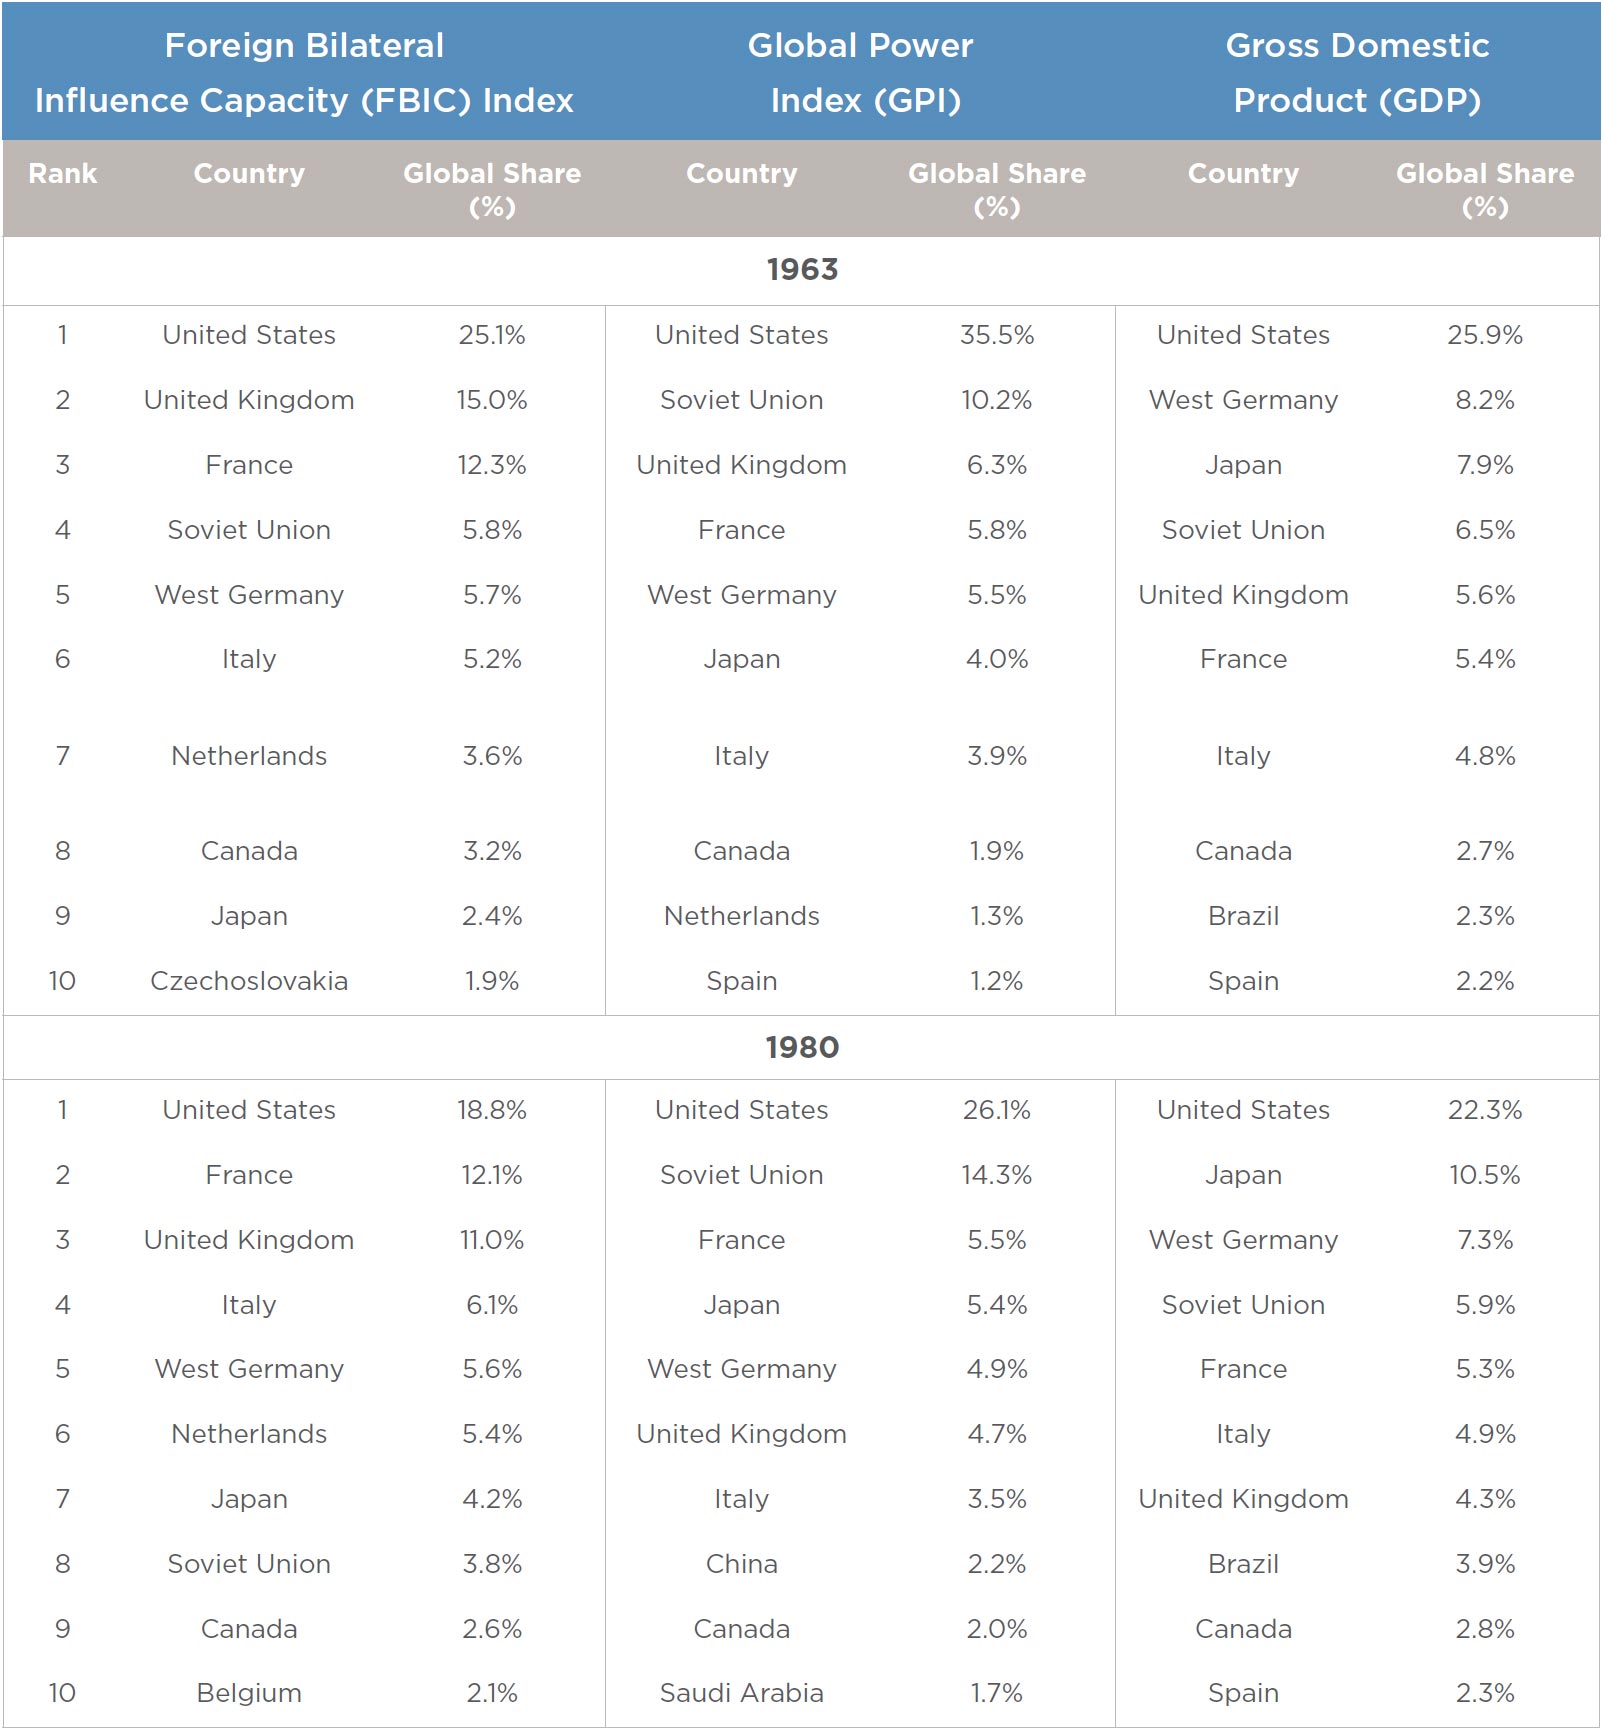
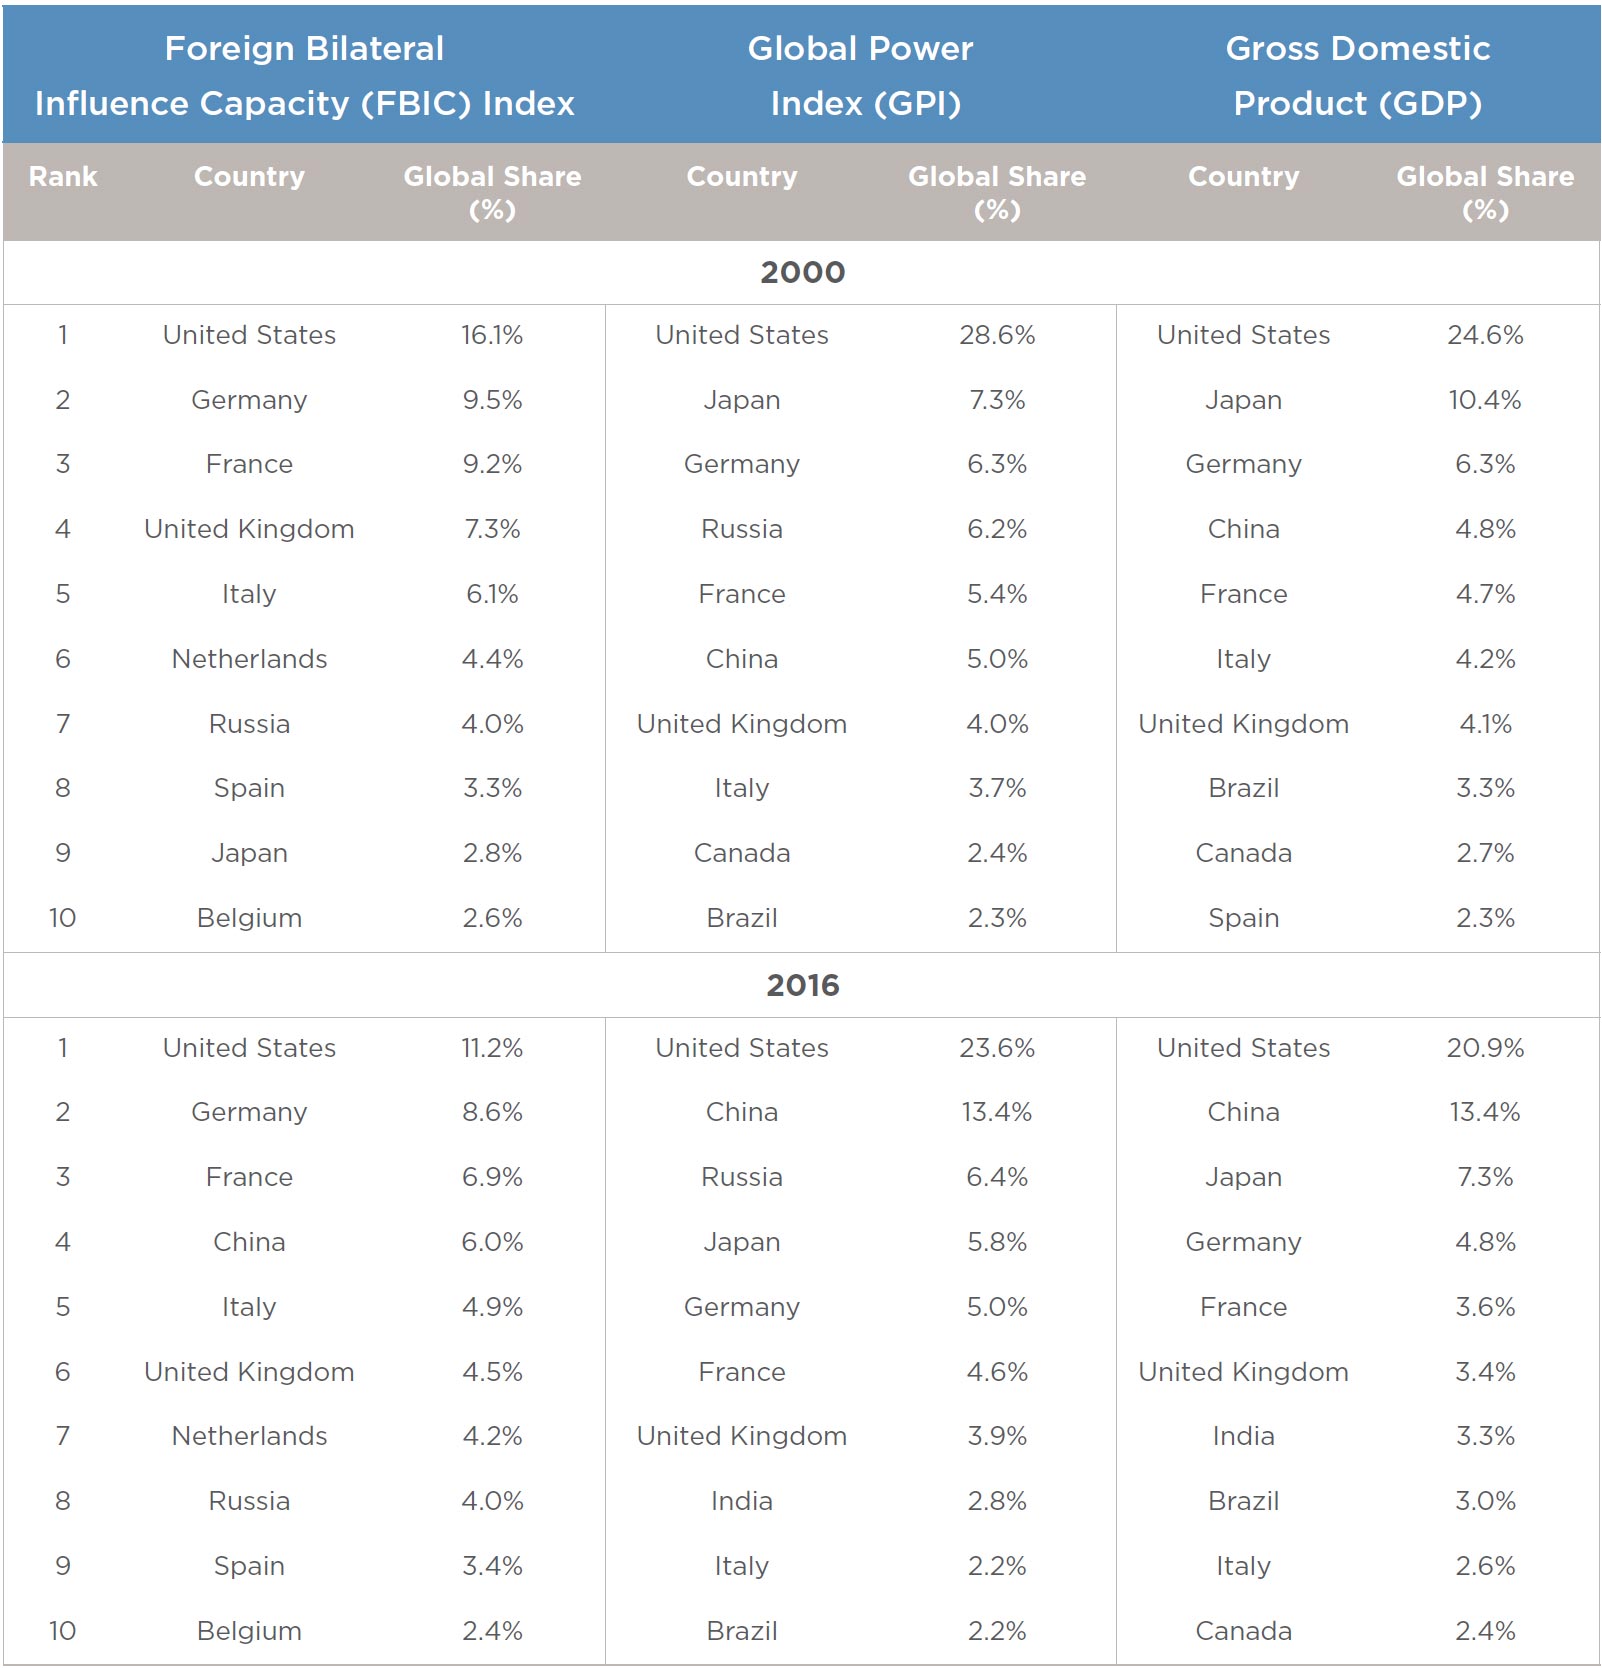
Table 4 shows the ranking of the top ten countries according to their share of the FBIC Index, the Global Power Index (GPI),32 and GDP (MER) for 1963, 1980, 2000, and 2016. The United States retains the first position across this period and these three relatively distinct measures of power and influence. However, its share of influence, power, and economic output has reduced consistently. In 1963 the United States possessed 25 percent of the world’s influence, 35 percent of the world’s power, and 40 percent of the world’s economic output. Today, it has 11 percent of influence, 23 percent of power, and 25 percent of economic output.
The rankings within the tables have also changed. While many countries positioned at the top of the rankings in the early 1960s have seen their global share of influence, power, and economic output decline, some have also fallen in rank. The United Kingdom, for example, historically has ranked in the top four for influence, power, and economic output, but has declined to the middle of the top ten ranking. The Soviet Union also held a large share of influence, power, and economic output. In 1963 it possessed 6 percent of influence, 10 percent of power, and 8 percent of economic output. But today, Russia has seen its international shares of influence, power, and the global economy reduced to 4 percent, 6 percent, and 2 percent respectively. States that have increased their rank most across time are China, Germany, and Japan. China first appeared in the top ten in the Global Power Index in 1980. It joined the top ten in economic output by 2000, but remained off the list of top ten influencers. However, by 2016, China ranked second on power and prosperity and fourth on influence.
Table 4: A comparison of national shares of the top ten countries according to the FBIC Index, GPI, and GDP, in 1963, 1980, 2000, and 2016
The FBIC Index captures something distinct from measures that are more materially oriented like the GPI. The GPI is a nuanced country-year measure of national capabilities that includes aspects that are material, institutional, and (broadly) relational. It is not simply a measure of material capabilities like the Composite Index of National Capabilities (CINC). Because it is measured at a country level and not dyadically, it can be assumed that it is meant to capture a general ability to achieve broad-based outcomes in the international system and not particular outcomes across individual state relationships.
The relational measure of bilateral influence introduced here may clarify a puzzle: if the United States possesses 23 percent of the world’s coercive capabilities, does it really get its way nearly one quarter of the time in comparison to the rest of the world? While such a question is impossible to answer, it is likely not the case. Does the United States achieve outcomes in the international system nearly five times as often as Germany?
The answer may be that coercive capabilities are 1) not an effective way to get other states to do what they otherwise would not have done and that 2) more accurate measures of influence are relational. The United States, for example, possesses 23 percent of coercive capabilities; the next countries in the top nine possess 54 percent; and the rest of the world the remaining 31 percent. Despite its larger percentage of coercive capability, however, the United States often does not get other states to go along with its preferences in many important international policy dossiers, whether it concerns international trade conditions or rules and regulations against climate change. This is better understood when looking at the FBIC measurement, which shows that the United States possesses 11 percent of influence, the next top nine countries 40 percent, and the rest of the world a whopping 49 percent.
This suggests that the FBIC Index may provide additional information concerning the ability of states to coerce and co-opt other states and therefore may capture some aspects of international relations compared with more traditional measures of material capabilities. Within the multi-dimensional space of measuring and modeling international relations it may be a key intervening factor, in addition to leadership or covert activity that remain under-measured.
The Countries That Punch Above and Below Their Weight
While the FBIC Index and GPI are clearly distinct, they are empirically related. Figure 3 shows the GPI score of states along the horizontal axis and their FBIC Index score on the vertical axis. This shows which states have more influence capacity (their FBIC score) than you would expect based on their coercive capabilities (their GPI score).
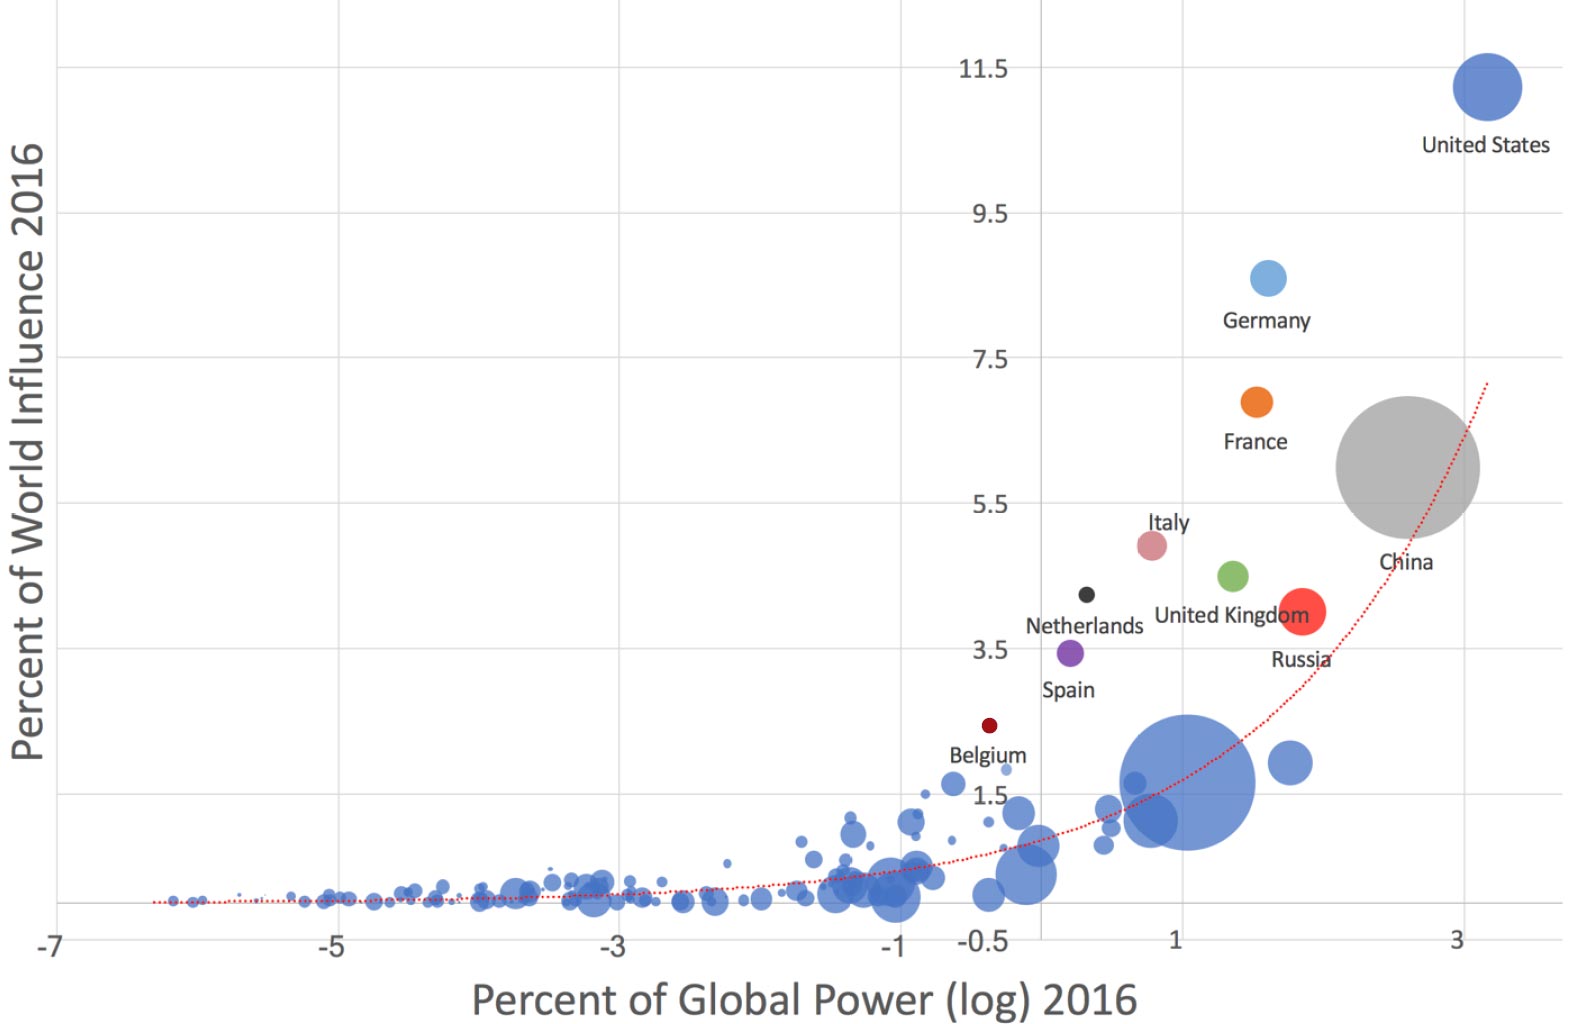
Figure 3: Natural Logarithm Global Power Index, 2016 (x-axis) and Sum of FBIC Index, 2016 (y-axis)
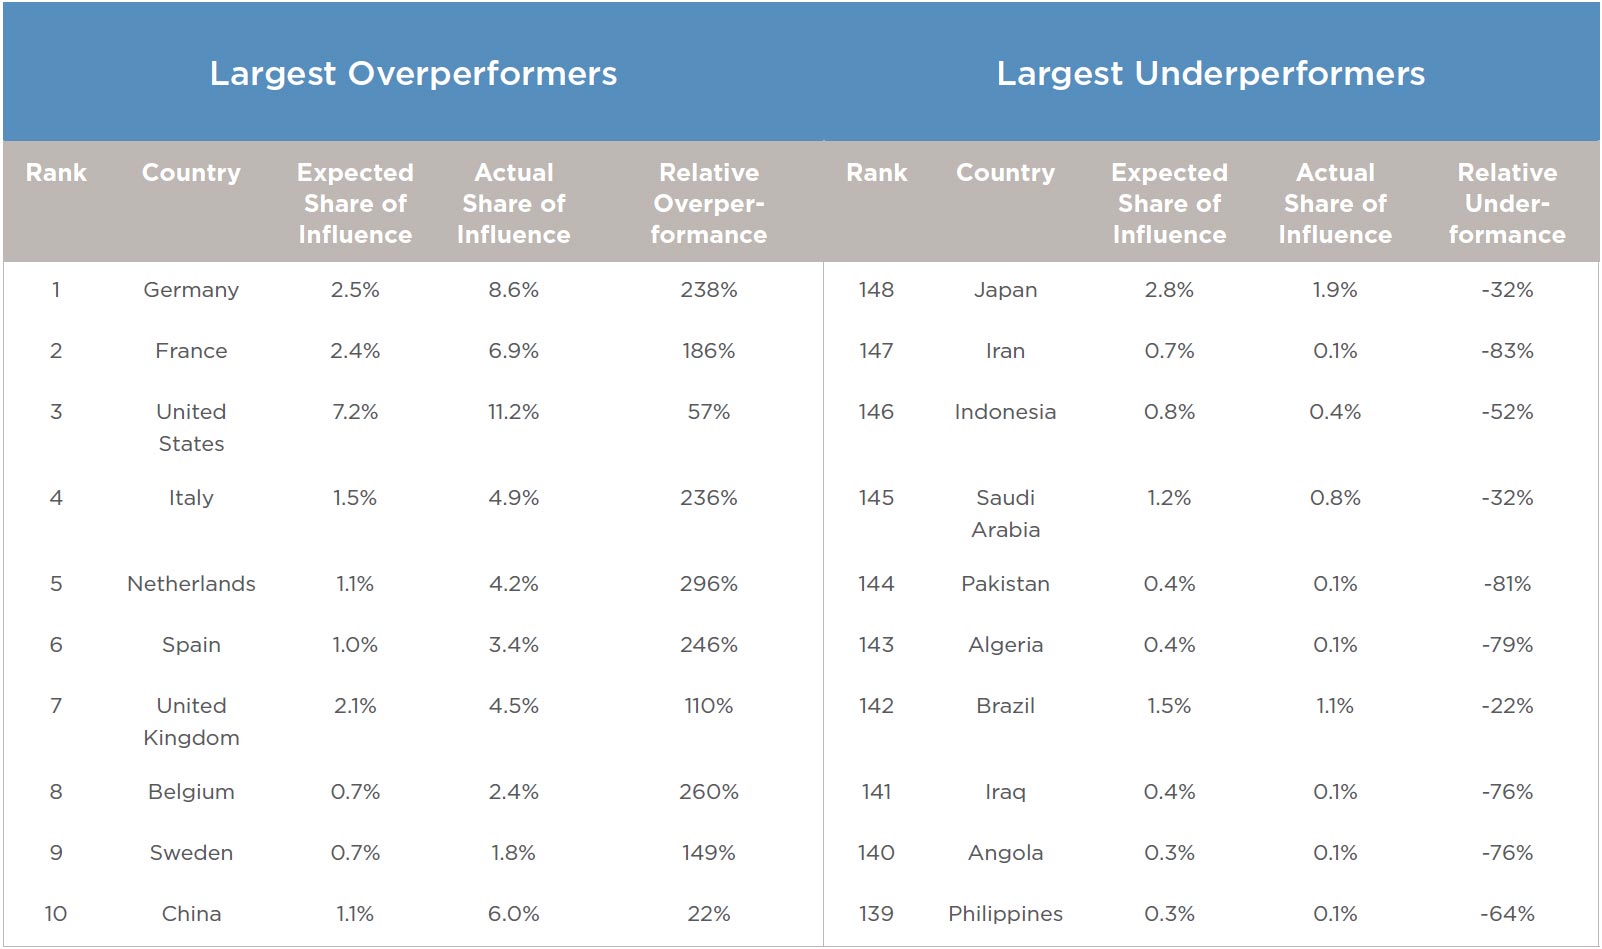
Table 5: Comparing the sum of FBIC and GPI: Which countries punch above and below their weight
Table 5 shows the ten countries that punch most above and below their weight. The countries that do best on this measure are European and (if only slightly) the United States. The country that most underperforms is Japan, punching below its weight by the total sum of influence of a middle-sized country. Brazil, China, and India each also do slightly worse on these measures than one would expect based on their material capabilities.
The Regional Reach of Influential States
Figure 4 shows the regional distribution of the influence of the top ten most influential countries. The United States’ influence is broadly and evenly distributed around the world with the lowest regional influence shares in South and Central Asia. The seven European states in this distribution each have more than half of their overall influence within Europe (with the exception of France, which has slightly less than 50 percent of influence in Europe). This somewhat diminishes the relevance of these states’ performance on the influence index, as a high degree of intra-EU influence—largely due to complex power sharing arrangements between Brussels and national capitals in international affairs—does not always translate into the ability to align the Bloc’s considerable resources behind a common objective. With regards to these states’ external influence at the individual level, this is largely concentrated in Africa (Belgium, France), the Middle East and North Africa (France, Italy), or more evenly distributed worldwide (Netherlands, Germany, Spain, United Kingdom). Chinese influence is relatively evenly distributed regionally around the world, though large shares exist in East and Southeast Asia and Africa (more on that below). The largest share of Russian influence is in Europe and the second largest is in South and Central Asia. Generally speaking, the degree to which China and the United States have succeeded in geographically diversifying their influence portfolios places them head and shoulders over their European and Russian counterparts in terms of their potential capacity to compel and co-opt states worldwide. The reach of these behemoths’ influence also extends to (other) NATO member states and the African Continent, as will be further explored in the remainder of this paper.

Figure 4: Regional influence portfolios, top ten influencers, 2016
Chinese and Russian Influence in NATO Member States
Lately there has been considerable concern about Russia’s assertiveness, aggression, and interference in NATO member states.33 In the previous ten years, Russia has launched overt and covert military attacks, interfered in internal politics,34 conducted other intelligence operations, including assassinations,35 and has either threatened or blocked energy supplies to NATO and NATO-aligned states.36 Moreover, Russia has been cultivating relationships with specific NATO states to undermine the alliance. Understandably, Russian influence on NATO member states has been a point of concern for those affected. Our index does not capture all this meddling but shows that formal Russian influence in NATO has decreased due to sanctions following its military intervention in Ukraine. A comparison of Russian and Chinese influence in NATO member states yields two different stories. Russian influence grew considerably at the end of the Cold War as countries began to economically connect. This growth in influence largely plateaued in the mid-1990s and declined only recently. Chinese formal influence capacity, however, has grown steadily starting in the early 2000s and has recently surpassed the formal capacity of Russia to influence NATO members. While Russia’s activities therefore are and should be a real cause of concern, Western political leaders should keep their eyes on the ascent of China as well.
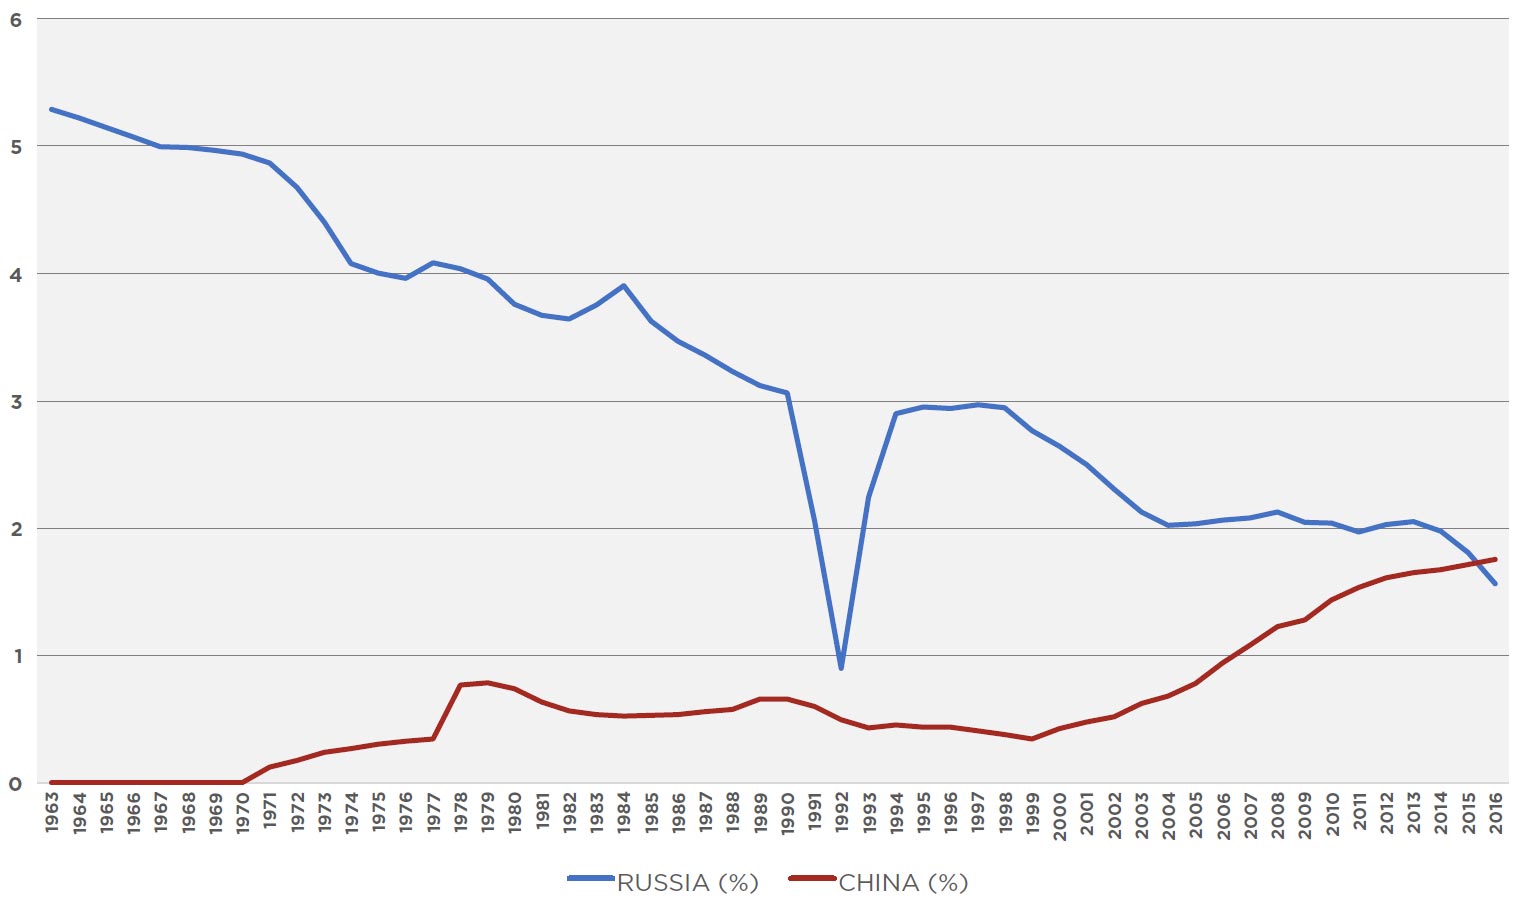
Figure 5: Chinese and Russian FBIC scores in NATO member states
Africa is Rising Along with Chinese Influence
Competition over influence in Africa is heating up. Historically an arena of European great power competition, the continent is set to be even more relevant in tomorrow’s geopolitics. The major European powers have experienced a dramatic decline in their share of influence in the continent. France’s influence fell most dramatically from 37 percent to 8 percent from the early 1960s to present. The United Kingdom’s influence share declined from 13 percent to 3 percent in the same period. The United States declined from less than 13 percent to about 10 percent. In contrast, China’s and India’s influence shares have been growing. India’s share increased from about 1 percent in 1991 to about 4 percent in 2016. The most drastic growth of influence was registered by China, which has gone from holding less than 1 percent of influence in the early 1960s to 13 percent today. Presently, China has the greatest share of influence in Africa, followed by the United States, but China’s share shows an upward trend while the United States’ does not. See Figure 6.
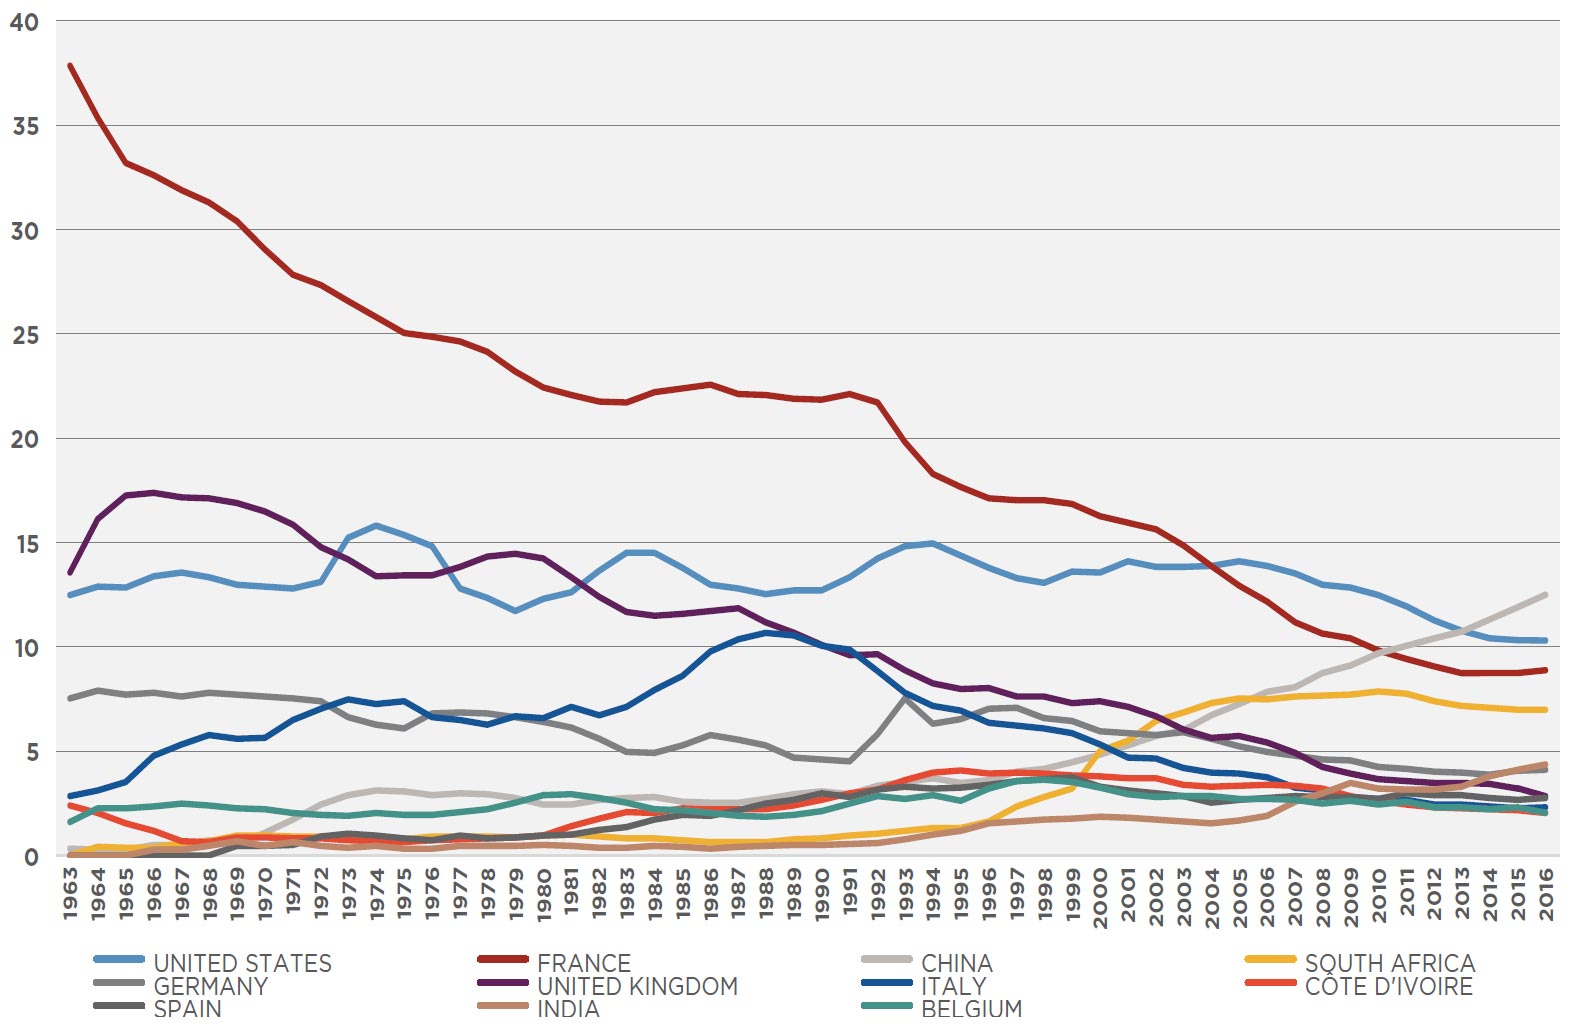
Figure 6: Trends in influence in Africa: China’s ascent
China surpassed the United States in Africa by 2013. This contrasts with the global pattern of influence where the United States maintains a robust lead largely owing to its greater security influence. In Africa, however, China overtakes the United States in all components including those in the security domain. The United States maintains a lead in alliances as it has formal security agreements with African states whereas China has none—though they are increasing military-to-military relations at a rapid pace. But China transfers arms at much greater volumes to African states—and is currently the largest arms supplier.
This reflects findings by other studies about the rise of Chinese influence in Africa. They note that China’s engagement in the continent is driven by mercantile interests, in particular its need for natural resources and access to consumer markets.37 China has been able to exceed influence by other great powers because of its aggressive strategy and willingness to exclude political conditionalities.38 The latter grants dictatorial and disreputable African states access to money and equipment they cannot gain through Western powers.39 Our findings highlight China’s role in providing security equipment to African states with mixed human rights records, including Zimbabwe and Sudan. Most of these countries also have close economic ties with China, which suggests these arms transfers prop up client regimes at the expense of democracy and human rights. These developments are cause for concern for Western policymakers, as they are potentially synonymous with the negative externalities brought on by the further destabilization of African nation states.
Zones of Contestation: Pivot States
Some states possess strategic military, economic, and ideational assets that make them attractive allies to great powers. These assets also grant them the independence to leverage their position in the international system, which means they are not client states. Instead they often operate in overlapping spheres of great power influence. Changes in their associations have significant repercussions on regional and great power politics. Focusing on these states allows us to examine arenas of significant and consequential great power competition. We refer to these states as “pivot” states.40
We have used the FBIC Index to identify states that are currently the focus of competition between China, Germany, Russia, and the United States.41 Table 6 shows the most contested pivot states in 2016 in which two great powers possess at least 15 percent of total influence. Some are small and are at the heart of regional rivalries, such as Turkmenistan and Mongolia. Others are larger and are central geopolitical flash points, such as Iran, Nigeria, Pakistan, Syria, and Venezuela.
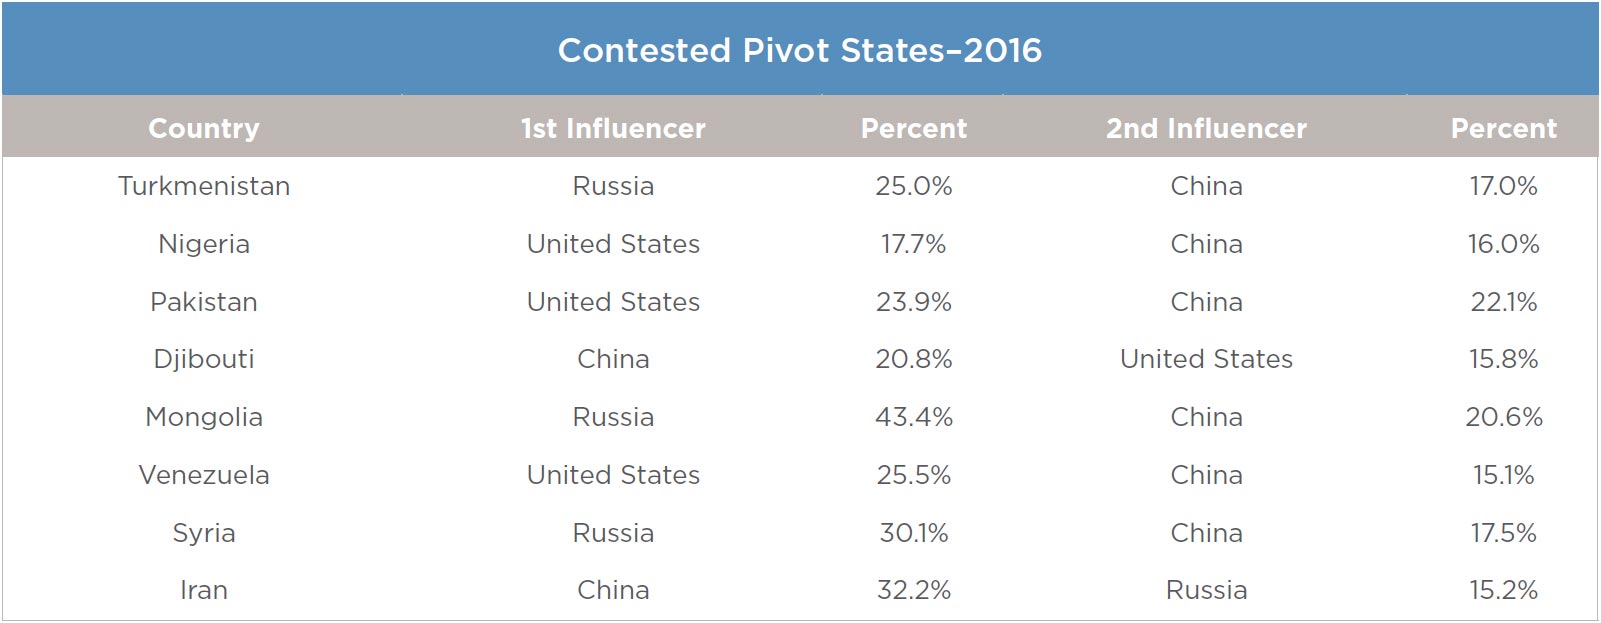
Table 6: Contested pivot states
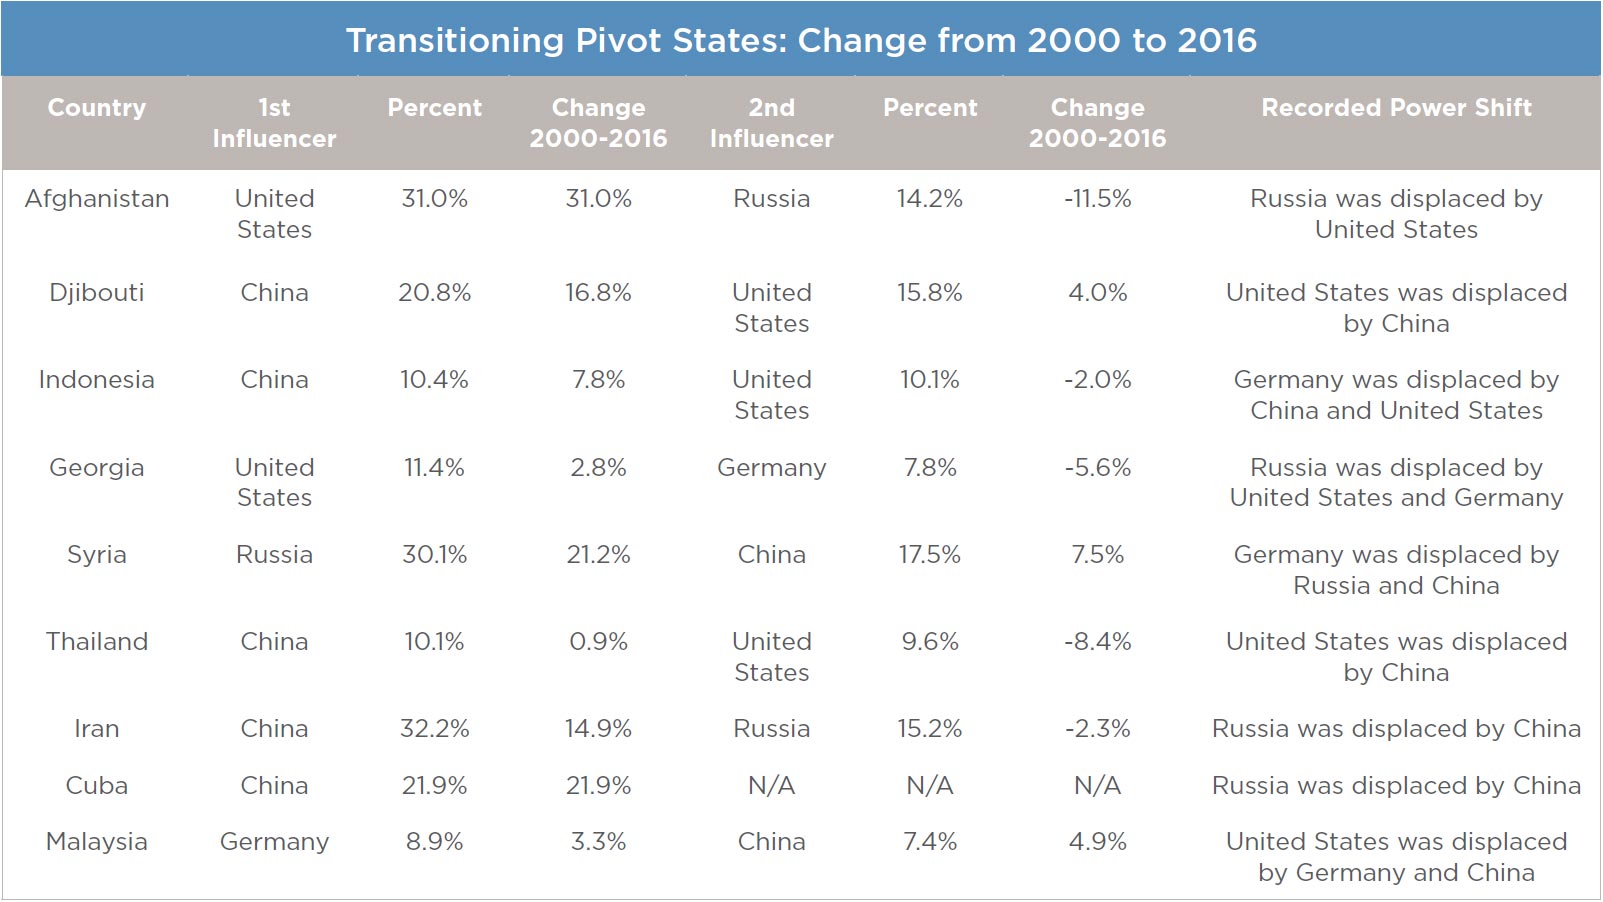
Table 7: Recently transitioned pivot states
Pivot states in overlapping spheres of interest are geographical focal points where great power interests collide and clash. The changing allegiance of pivot states may have significant regional security repercussions. To operationalize relative great power gains over time, we compiled a list of pivot states in which the main influencer changed between 2000 and 2016.42 These are presented in Table 7. IMAGE
Table 7 shows several noteworthy trends. The first is that Russia clearly lost its preeminent position in various pivot states. In several cases—most notably in Georgia—the Kremlin’s influence has waned to such a degree that it has been overtaken by several rival great powers over the course of the 2000-2016 period. Germany and the United States also incurred losses. Germany only gained significant ground in Georgia and Malaysia. The United States only overtook rivals in those countries which closely border Western spheres of influence (Georgia) and in another it invaded in 2001 (Afghanistan). Beijing emerges as the undisputed winner over the course of the 2000-2016 period. Not only has growing Chinese influence served to displace rivals in the country’s regional vicinity, it has also translated into controlling influence shares in pivot states such as Iran. Overall, trend dynamics surrounding China’s rising influence not only reveal China’s ascent but also show considerable Sino-Russian competition.
Networks of Influence
While the FBIC Index is not itself a measure of network density or centrality, it can be used with network visualization aids to get a better sense of how networks of influence within the international system are developing.43 This sheds another light on the rise and fall of particular states and the reach and scope of spheres of influence. Our findings reveal first and foremost an international system that is increasingly characterized by the density of its networks in the context of the meteoric rise of China. In 1995 (Figure 7) the international system was largely dominated by the United States with a sphere of influence that stretched across the Northern and Southern Americas and into East and Southeast Asia. Europe is represented in this network visualization by two spheres of influence, one dominated by Germany and the United Kingdom, and the other by France. Russia and China were both within a loose sphere of influence with other former-Soviet states.
By 2015 the structure of international influence had dramatically shifted. China by then was in possession of a significant sphere of influence of its own. The United States retained influence in North and South America as well as with countries in East and Southeast Asia. Europe remained characterized by two spheres of influence, one more dominated by Germany and the United Kingdom, and another by France (though many states play significant roles in this dense network of influence). Russia retains a relatively small sphere of influence comprised of mainly former Soviet Union states. A new sphere of influence has emerged among Gulf States in the Middle East with multiple actors vying for control.
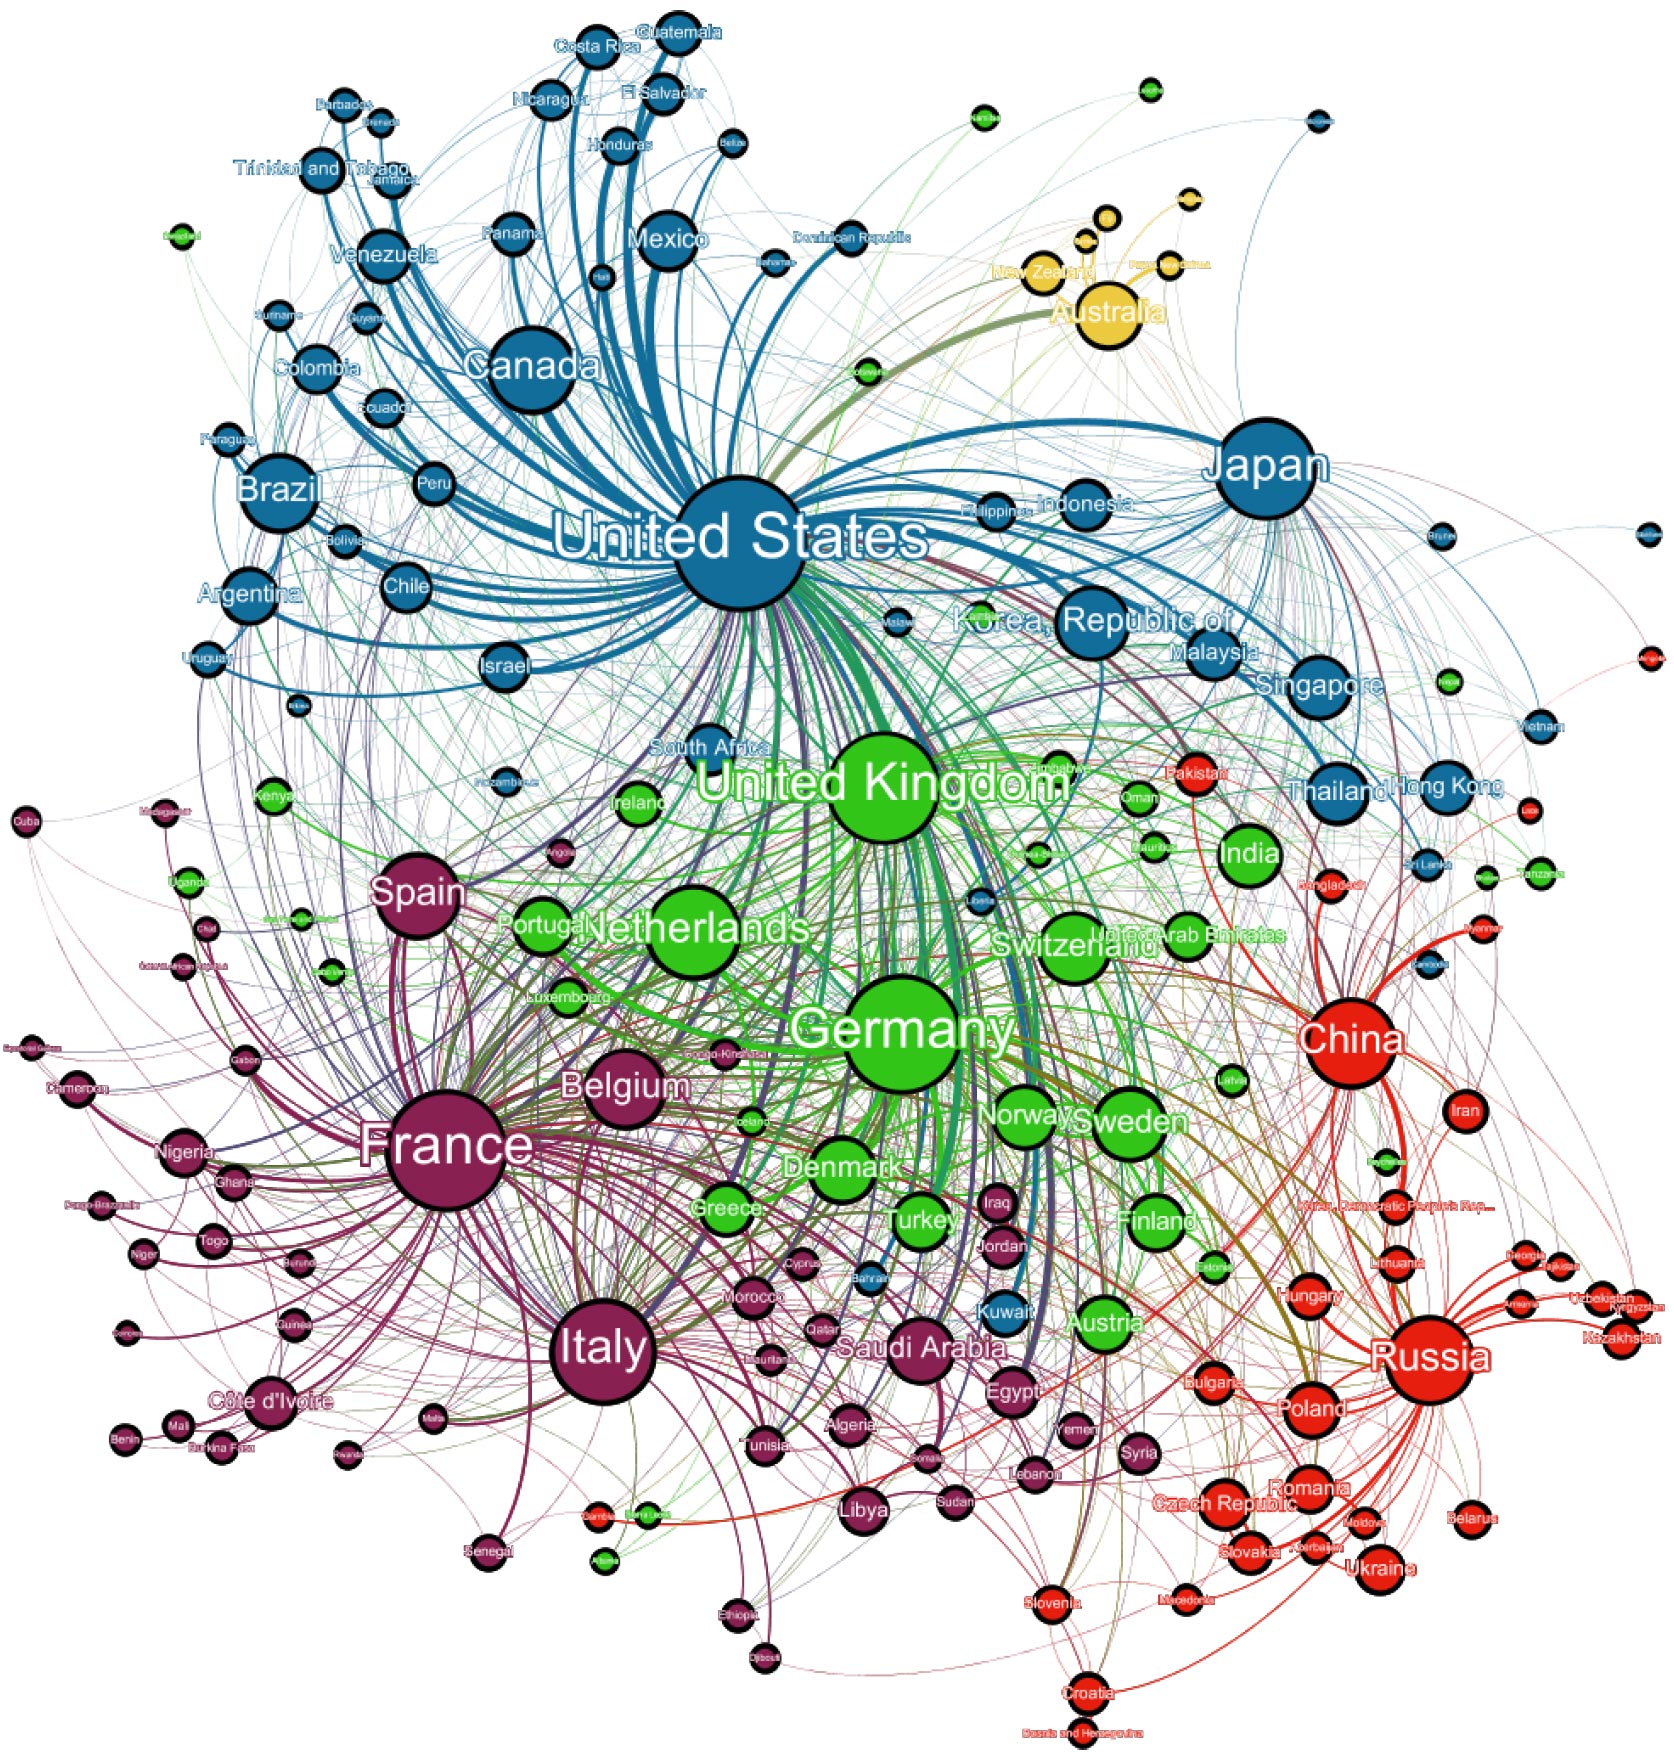
Figure 7: Network visualization of the structure of influence in the international system, 1995
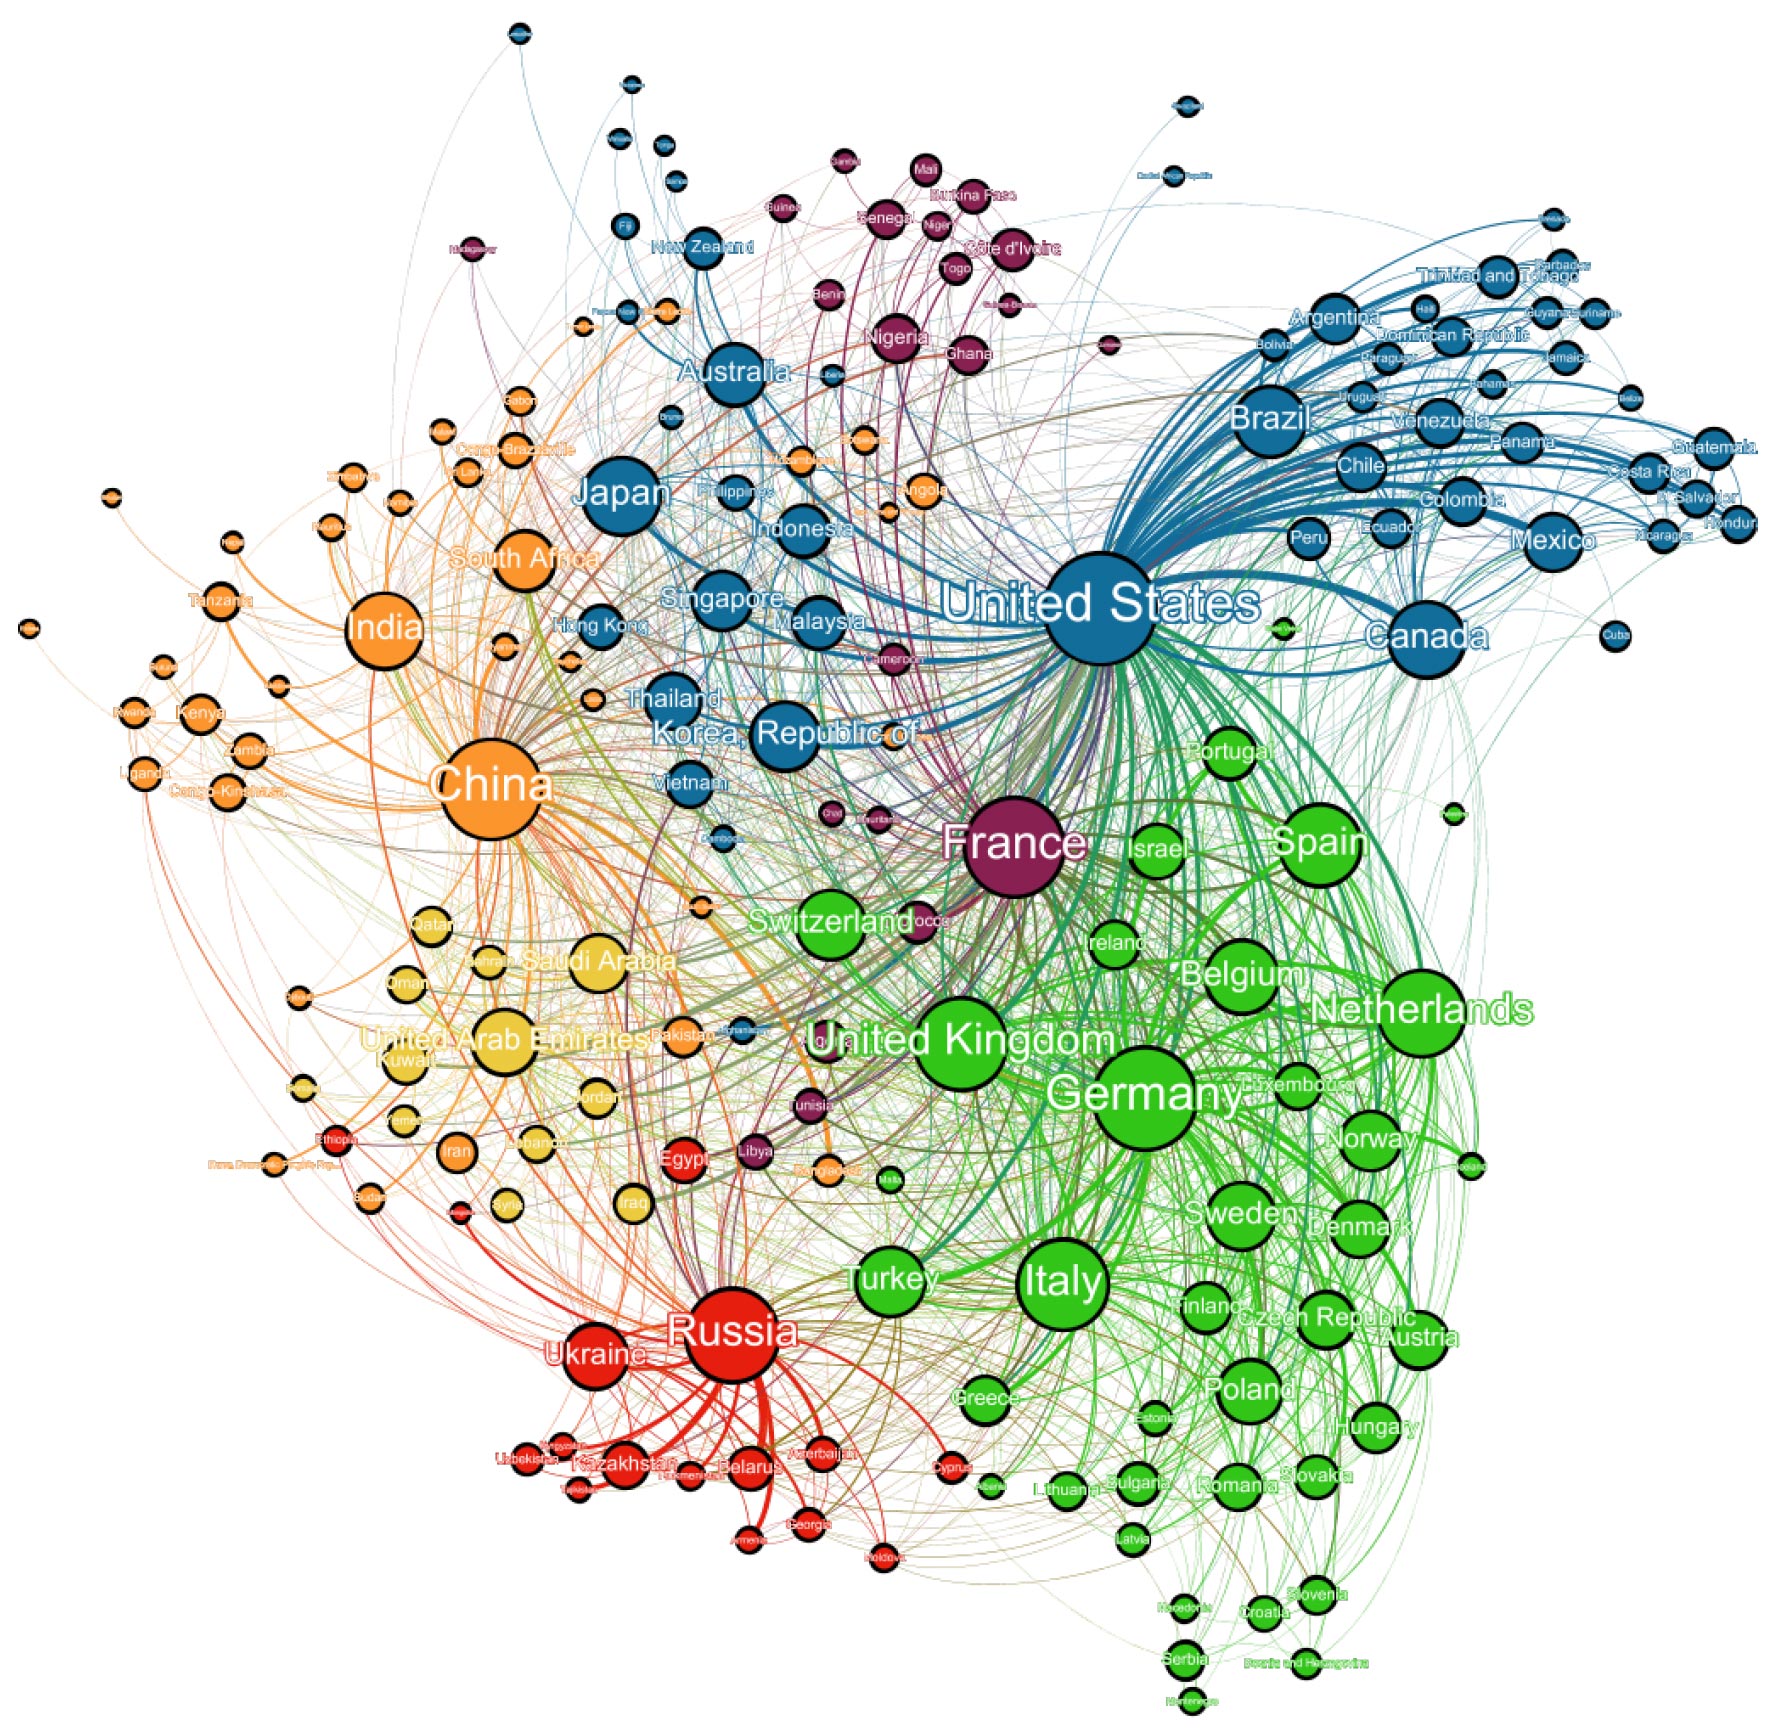
Figure 8: Network visualization of the structure of influence in the international system, 2015
Insights and Implications
In the context of state-sovereignty movements, political leaders propagate the benefits of international withdrawal and downplay the benefits associated with international participation and globalization. Thus far, proponents of international interconnection have lacked a quantified framework to make the case that power and influence in a globalized world require engagement in the economic, political, and security spheres in order to shape and affect state decision- making. Discussions therefore typically revert to variations on very similar themes (“globalization leads to prosperity”) in the absence of concepts and metrics to gauge the merits of arguments for either side.
With the FBIC Index, we attempt to fill this gap by putting the concept of relational influence center stage. We argue that a state’s ability to compel or co-opt other states to cooperate may be dependent on more than the sheer accumulation of coercive capabilities and hinges on its ability to exert influence through economic, political, and security relations. Modern statecraft includes significant aspects of deploying relational power to achieve outcomes and promote national interests.
Our findings reveal that global influence is dispersed and spreading. A growing number of states wield greater amounts of influence over larger geographical distances than before. At the same time, new key influencers are rising. China’s upward trajectory over the past two decades has been nothing less than staggering in terms of its overall magnitude and reach, in Asia, NATO member states, and Africa. Russia, meanwhile, has been losing considerable relational influence (though perhaps gaining influence through illicit activities). The United States remains ahead, in overall influence capacity, but its relative share has been shrinking and is considerably smaller than its share of material capabilities or economic mass. European states, also some of the smaller ones such as the Netherlands, significantly punch above their weight in comparison to the size of their economies. Competition over spheres of influence are certainly not disappearing. Traditional pivotal regions in the Middle East, Central Asia and Southeast Asia, and the pivot states within them, continue to be coveted by great powers that vie for influence for military-strategic, economic, and also ideological reasons. Meanwhile, worldwide networks of influence are emerging (e.g., the Middle East) and/or reconfiguring around a new dominant player (e.g., China).
The future of the international system will be characterized by multi-layered and competing spheres of influence across state, non-state, and intergovernmental organizations, while patterns of global influence will continue to evolve. In a forthcoming report, we will project patterns of relational influence into the future to better understand the unfolding shape of the international system to come.
Notes
1 The last of three reports we worked on together was: “Global Trends 2030: Alternative Worlds” National Intelligence Council, November 2012, https://www.dni.gov/files/documents/GlobalTrends_2030.pdf.
2 “Risk Nexus: Overcome by cyber risks? Economic benefits and costs of alternate cyber futures,” Atlantic Council and Frederick L. Pardee Center for International Futures, September 2015, http://publications.atlanticcouncil.org/cyberrisks/.
3 Mathew J. Burrows, “Reducing the Risks from Rapid Demographic Change,” Atlantic Council, September 2016, http://www.atlanticcouncil.org/publications/reports/reducing-the-risks-from-rapid-demographic-change.
4 “Our World Transformed: Geopolitical Shocks and Risks,” Atlantic Council and Frederick L. Pardee Center for International Futures, April 24, 2017, https://www.zurich.com/en/knowledge/articles/2017/04/geopolitical-shocks-and-risks-atlantic-council-report.
5 For Trump’s Proposal, see “A New Foundation for American Greatness: Fiscal Year 2018,” Office of Management and Budget, https://www.whitehouse.gov/sites/whitehouse.gov/files/omb/budget/fy2018/budget.pdf; see also “The Key Spending Cuts and Increases in Trump’s Budget,” New York Times, May 22, 2017, https://www.nytimes.com/2017/05/22/us/politics/trump-budget-winners-losers.html?mcubz=3&_r=0; for Great Britain, see John McDermott, “UK Foreign Office ministers warn over cuts,” Financial Times, November 2, 2015, https://www.ft.com/content/51af3ef0-8158-11e5-8095-ed1a37d1e096; for France, see Tony Cross, “France to face extra budget cuts to meet EU deficit target,” RFI, July 11, 2017, http://en.rfi.fr/economy/20170711-france-face-extra-budget-cuts-meet-eu-deficittarget. Germany, on the other hand, increased its spending; see Nils Zimmermann, “German federal budget goes up for 2017,” Deutsche Welle, November 25, 2016, http://www.dw.com/en/german-federal-budget-goes-up-for-2017/a-36528845.
6 Jeff D. Colgan and Robert O. Keohane, “The Liberal Order Is Rigged,” Foreign Affairs, April 17, 2017, https://www.foreignaffairs.com/
articles/world/2017-04-17/liberal-order-rigged.
7 For an excellent overview of various explanations, see Ronald Inglehart and Norris, Pippa, “Trump, Brexit, and the Rise of Populism: Economic Have-Nots and Cultural Backlash,” HKS Working Paper No. RWP16-026, July 29, 2016, http://dx.doi.org/10.2139/ssrn.2818659.
8 See for example Joseph S. Nye Jr., “Get Smart: Combining Hard and Soft Power,” Foreign Affairs, July 1, 2009, https://www.foreignaffairs.com/articles/2009-07-01/get-smart; Hillary Rodham Clinton, “Leading Through Civilian Power,” Foreign Affairs, November 1, 2010, https://www.foreignaffairs.com/articles/north-america/2010-11-01/leading-through-civilian-power.
9 Searching JSTOR according to the ‘power’ and ‘influence’ parameters yields 160,980 and 165,418 results respectively.
10 See Ruth Zimmerling, Influence and Power: Variations on a Messy Theme (Dordrecht: Springer, 2005), 104–47; see also Ingmar Pörn, The Logic of Power (Oxford: Basil Blackwell, 1970), 68; Harold D. Lasswell and Abraham Kaplan, Power and Society: A Framework for Political Inquiry (New Haven: Yale University, 1950), 71; Serge Moscovici, “Sozialer Wandel Durch Minoritäten,” in Social Influence and Social Change, trans. A. Hechler (London: Academic Press, 1979), 77; and Joseph Raz, Practical Reason and Norms, 2nd ed. (Princeton: Princeton University Press, 1975), 99.
11 See Allen Baldwin, Economic Statecraft (New Jersey: Princeton University Press, 1985), 489; see also Joseph S. Nye Jr., The Future of Power (New York: PublicAffairs, 2011), 12.
12 Max Weber, The Theory of Social and Economic Organization (New York: The Free Press, 1947), 152.
13 Weber, Theory, 152.
14 See Robert A. Dahl, The Concept of Power (New York: Bobbs-Merrill, 1957), 202–3; see also Steven Lukes, Power: A Radical View (New York: Palgrave Macmillan, 2005), 36. Note that Lukes takes a mixed view on influence and power, and occasionally divorces the terms from one another entirely.
15 David A. Baldwin, “Interdependence and Power: A Conceptual Analysis,” International Organization 34, no. 4 (1980): 502.
16 See Dorwin Cartwright, “Influence, Leadership, Control,” in Handbook of Organizations, ed. James G. March (New York: Routledge, 1965), 125; see also C. W. Cassinelli, Free Activities and Interpersonal Relations (The Hague: Martinus Nijhoff, 1966), 47–48; John R. P. French and Bertran Raven, “The Bases of Social Power,” in Studies in Social Power, ed. Dorwin Cartwright (Michigan: University of Michigan Press, 1960), 609; John R. P. French, “A Formal Theory of Social Power,” Psychological Review 63 (1956): 728; Robert W. Cox and Harold Karan Jacobson, The Anatomy of Influence: Decision Making in International Organization (New York: Yale University Press, 1973), 3; and Lukes, Power, 205.
17 See Kenneth N. Waltz, Theory of International Politics (London: Addison-Wesley, 1979), 102–11; Hans Morgenthau, Politics among Nations: The Struggle for Power and Peace, 3rd ed. (New York: Alfred A. Knopf, 1948), 15.
18 See Zimmerling, Influence and Power, 104.; see also Dennis H. Wrong, Power: Its Forms, Bases, and Uses (Oxford: Basil Blackwell, 1988), 21; and Lasswell and Kaplan, Power and Society, 76–77, 84.
19 Zimmerling, Influence and Power, 146.
20 Wrong, Power, 13.
21 Wrong, 4, 23.
22 David A. Baldwin, “Power and International Relations,” in Handbook of International Relations, 2nd ed. (London: SAGE Publications, 2011), 275.
23 John J. Mearsheimer, The Tragedy of Great Power Politics (New York: W. W. Norton & Company, 2001), Chapter 8; Waltz, Theory of International Politics, 102–11; Morgenthau, Politics among Nations: The Struggle for Power and Peace, 15.
24 See Baldwin, “Power and International Relations,” 275.
25 See Zimmerling, Influence and Power, 123; see also Nye, The Future of Power, 13; Harold Dwight Lass well and Abraham Kaplan, Power and Society: A Framework for Political Inquiry (Yale University Press, 1965), 83; Andrew Heywood, Key Concepts in Politics (New York: Macmillan, 2000), 35; G Kuypers, Grondbegrippen van politiek (Utrecht; Antwerpen: Het Spectrum, 1973), 84, 87; Dahl, The Concept of Power, 202-3; and Matteo Pallaver, “Power and Its Forms: Hard, Soft, Smart,” (thesis, London School of Economics and Political Science, 2011), 12, http://etheses.lse.ac.uk/220/1/Pallaver_Power_and_Its_Forms.pdf.
26 For more information on the methodology used to construct the FBIC, please see pardee.du.edu/working-papers.
27 Jonathan D. Moyer, Alanna Markle, and Whitney Doran, “Relative National Power Codebook,” Diplometrics (Denver: Frederick S. Pardee Center for International Futures, Josef Korbel School of International Studies, University of Denver, 2017), pardee.du.edu/diplometrics; see also Gregory Treverton and Seth G. Jones, “Measuring National Power” (RAND Corporation, 2005), and Ashley J. Tellis et al., “Measuring National Power in the Postindustrial Age” (Santa Monica: RAND National Security Research Division, 2000) for other examples of indices which gauge influence (or something close to it) by virtue of a state’s material capabilities.
28 J. David Singer, Stuart Bremer, and John Stuckey, “Capability Distribution, Uncertainty, and Major Power War, 1820-1965,” Peace, War, and Numbers 19 (1972): 48.
29 GFP, “Global Firepower - Ranking the World Military Strengths,” 2017 Military Strength Ranking, 2016, http://www.globalfirewpoer.com/index.asp.
30 See Mearsheimer, The Tragedy of Great Power Politics, Chapter 8, Waltz, Theory of International Politics, 102–11, and Morgenthau, Politics among Nations, 15, for a discussion of resource-based power.
31 “State System Membership List, v2016,” Correlates of War Project, 2017, http://www.correlatesofwar.org/data-sets/state-system-membership.
32 The Global Power Index (GPI) is housed at the Pardee Center for International Futures and represents a largely material account of relative power in the international system, though it does move beyond a strict measure of material capabilities to include aspects of diplomatic capabilities as well. It is less oriented towards material drivers of power when compared with previous measures, like the Composite Index of National Capabilities. See pardee.du.edu/diplometrics.
33 Stephan De Spiegeleire, From Assertiveness to Aggression: 2014 as a Watershed Year for Russian Foreign and Security Policy (The Hague Centre for Strategic Studies, 2015), http://www.hcss.nl/reports/from-assertiveness-to-aggression/168/.
34 Constanze Stelzenmüller, “The Impact of Russian Interference on Germany’s 2017 Elections,” Brookings Institution, June 28, 2017, https://www.brookings.edu/testimonies/the-impact-of-russian-interference-on-germanys-2017-elections/.
35 Andrew E. Kramer, “Hours Before He Died, a Putin Critic Said He Was a Target,” New York Times, 2017, https://www.nytimes.com/2017/03/23/world/europe/a-russian-critic-of-putin-is-assassinated-in-ukraine.html.
36 Yafimava Katja, The Transit Dimension of EU Energy Security: Russian Gas Transit Across Ukraine, Belarus, and Moldova (Oxford: Oxford Institute for Energy Studies, 2012).
37 Chris Alden, “China in Africa,” Survival 47, no. 3 (2005): 147-64.
38 Madison Condon, “China in Africa: What the Policy of Nonintervention Adds to the Western Development Dilemma,” Praxis: The Fletcher Journal of Human Security 27 (2012).
39 Clionadh Raleigh and Roudabeh Kishi, “When China Gives Aid to African Governments, They Become More Violent,” Washington Post, December 2, 2015, https://www.washingtonpost.com/news/monkey-cage/wp/2015/12/02/when-china-gives-aid-to-african-governments-they-become-more-violent/?utm_term=.48d2a5c5f161.
40 See Tim Sweijs et al., “Why Are Pivot States So Pivotal? The Role of Pivot States In Regional and Global Security” (The Hague: The Hague Centre for Strategic Studies, 2014). Pivot states are states which preside over strategically important economic, military, or ideational goods.
41 Based on data compiled by Sweijs et al., we generated a list of thirty-five states which—by virtue of their strategic goods—could be understood as being pivotal. We then narrowed this list down by compiling a list of those states in which at least two great powers command a minimum 15 percent of total international influence each. Great powers were compiled on the basis of 2016 GPI rankings, with Germany—attaining an international ranking of five rather than four—being included instead of Japan to proxy for European involvement. Recently transitioned pivot states are pivot states in which the main influencer has changed between the years 2000 and 2016.
42 States included in Table 7 are universally states which fall within Sweijs et al.’s list of 35 pivot states due to their presiding over strategic goods. The final list is yielded by identifying those states in which the main influencer in the year 2000 is no longer the main influencer in 2016.
43 The size of each node represents the sum of outgoing influence of a country. Node colors indicate communities within the network. The community detection algorithm used for this calculation comes from Blondel et al. (2008). The thickness of ties is determined by the natural log of influence from the sending to the receiving country, with tie color representing the community of the influencer. The visualization and community detection calculation use a filtered subset of connections greater than or equal to one standard deviation above the mean level of all bilateral influence (logged). After filtering, isolated nodes are removed. David Bohl led the development of this network analysis. Vincent D. Blondel et al., “Fast unfolding of communities in large networks,” Journal of Statistical Mechanics: Theory and Experiment, 2008, https://doi.org/10.1088/1742-5468/2008/10/P10008.
About the Authros
Jonathan D. Moyer is assistant professor at the Josef Korbel School of International Studies and director of the Frederick S. Pardee Center for International Futures at the University of Denver’s Josef Korbel School.
Tim Sweijs is the director of research at The Hague Centre for Strategic Studies (HCSS).
Dr. Mathew J. Burrows serves as the director of the Atlantic Council’s Foresight, Strategy, and Risks Initiative in the Scowcroft Center for Strategy and Security.
Hugo van Manen is a junior consultant at Ecorys in the Netherlands.
Thumbnail image courtesy of ptwo/Flickr. (CC BY 2.0)
For more information on issues and events that shape our world, please visit the CSS Blog Network or browse our Digital Library.
No comments:
Post a Comment