By Dmitriy Plekhanov
 Cheap labor has long been considered the main factor behind the Chinese economic miracle, propelling the country to the status of the world’s factory, shifting global supply chains, and igniting debates in other countries about companies moving their plants to China, the consequences of job outsourcing for domestic industries and workers, and unfair competitive advantages associated with the poor labor conditions of Chinese factory workers.
However, as is often the case in economics, the causes and effects can change their places. Cheap labor created the Chinese miracle, which, in turn, can finally eliminate the cheap labor phenomenon. Economic growth during the past 20 years has led to a rapid increase in wages. Thus the developments of the Chinese labor market have recently drawn increased attention from various economists and analysts trying to figure out what is happening with China’s most prominent global competitive advantage.
The official statistics in China indicates a tremendous increase in population incomes. But what matters for international competitiveness is cross-country comparison. Various analysts have proposed their estimates comparing the level of China’s wages and labor costs with other countries. For example, according to estimates from the Bank of America Merrill Lynch, hourly wages in Mexico in dollar terms in 2016 were 40 percent lower than in China. According to data from Euromonitor International, hourly manufacturing wages in China in 2016 exceeded those in every major Latin American economy except Chile and were at around 70 percent of the level in weaker Eurozone countries, such as Portugal. All in all, those estimates taken together indicate that China’s competitive advantage is definitely shrinking if it has not completely gone already.
However, international comparisons of wages are hampered by inadequate data. To be eligible for comparison, statistical indicators should be calculated on the basis of the same methodology, following internationally accepted statistical standards. But in the sphere of labor market statistics, there is a remarkable heterogeneity among countries in terms of methods and sources of data for estimating national wages.
This problem is especially pronounced for developing countries. Estimation of wages can differ by sources of data (administrative data, sample surveys, census), by coverage of various categories of enterprises and workers, periods of statistical observation, etc. For example, the official statistics in India do not cover all employed in industry, and in Mexico, the national data are available only since 2005.
China’s labor market statistics also have drawbacks, which impose even more restrictions on international comparisons. The difficulties encountered by the Chinese official statistics in measuring population earnings (income and wages) can be illustrated by the fact that the National Bureau of Statistics (NBS) still estimates economy-wide indicators such as GDP using mainly a production approach.
Data on Wages in China Are Not Representative
There is no single indicator of wages in Chinese official statistics. The official statistics on wages disseminated by the NBS come from different sources, which cover different categories of employees. This peculiarity of the Chinese official statistical system stems from the fact that the Chinese economy during recent decades has undergone a huge transformation from a command-style economy to some kind of market economy with Chinese characteristics. During this period, the capabilities of the official statistical system to monitor developments in the economy has been lagging behind the pace of changes in society in general. The role of state-owned enterprises in the economy decreased, new types of enterprises were introduced, migration from rural to urban areas increased dramatically, and the labor market underwent substantial informalization. As the traditional statistical system of China relied heavily on direct reporting in data collection process it quickly became inadequate under the new economic circumstances.
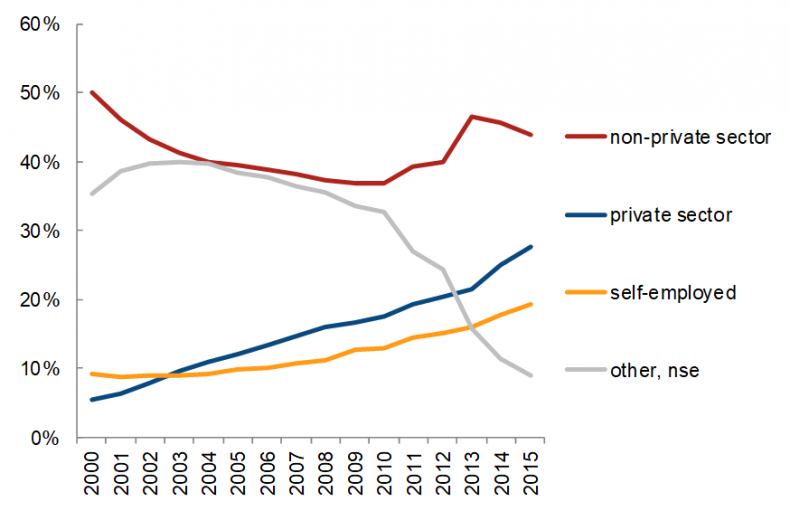
The first indicator of wages in China may be encountered in NBS annual statistical yearbooks and refers to “the average annual wage of persons employed in urban units.” This indicator is quite commonly used for analysis of wages dynamics and comparison with other countries. For example, the International Labor Organization (ILO) relies on these data to provide its estimate for average monthly earnings of employees in its ILOSTAT database. However the term used by NBS in its statistical yearbooks can be quite misleading. In a brief introduction section, which precedes the chapter on employment and wages, the NBS indicates that urban units actually refer to so-called “non-private urban units” (城镇非私营单位). Data on private units are thus formally excluded. According to NBS data, the number of people employed by non-private units accounts only for 23 percent of the total employment in the Chinese economy and less than half of the total urban employment. Thus the first type of indicator should not be mistakenly considered as representative of the whole economy in China.
What categories of enterprises does the non-private sector encompass? The mixing of socialist and capitalist features in modern China has resulted in a lot of complexity in using and interpreting statistical categories. Private as well as non-private sectors in Chinese official statistics represent mainly the registration status of enterprises rather than type of ownership. In China the non-private sector is composed of state-owned enterprises, foreign-funded enterprises, and such entities as collective enterprises, share cooperative enterprises, limited liability corporations, etc. Whereas the ownership type of state-owned enterprises is clearly defined, for other categories the answer may not be that simple. In fact, companies with dominant private owners can be registered as non-private entities in China. For example all companies with foreign funding are classified as belonging to the non-private sector.
Data on wages in the urban private sector (城镇私营单位), which represent businesses registered and controlled by individuals, appeared in Chinese official statistics in 2009. In that year, the NBS started to collect annual wage data on private enterprises through a specially set-up reporting system. Under this system, every enterprise employing more than 100 persons is required to report wage information directly, whereas enterprises with employing between 20 and 99 persons take part in sample surveys. The NBS estimates of wages in the private sector are published annually on the official website. However, the data are available only in the Chinese version. According to NBS data, urban employment in the private sector accounts for 28 percent of total urban employment in China.
All in all, the wages reporting system in Chinese official statistics currently covers about 290 million people (70 percent of total urban employment). This figure represents the sum of non-private and private sectors employment in urban areas. The residual 30 percent (about 115 million people) consists of individuals registered as self-employed and informal workers, whose employment status is not identified by the authorities. The official statistical system of China does not provide information on wages for these categories of workers. Workers in rural areas (about 370 million people) are also not covered by the wages reporting system. Thus in total data on wages are available for less than 40 percent of the total number of workers in the Chinese economy.
Since 2005, the NBS has actually started to conduct a regular annual survey among rural migrants. This category of workers consists of people who leave their place of residential registration and work in other rural or urban areas on a seasonal or permanent basis. Historically under the so-called hukou or household registration system, migrant workers in urban areas did not have the same rights as local residents and were mainly employed in the informal sector of the economy. The government has started to release these restrictions recently, although the progress has been slow so far. In the NBS survey, among other questions, migrants from rural areas are asked about their industry of employment and level of monthly wages. However the accuracy of survey results can be questioned as doubts exist concerning the willingness of respondents to reveal their true level of income.

Urban employment structure in China in 2000-2015. Data from NBS.
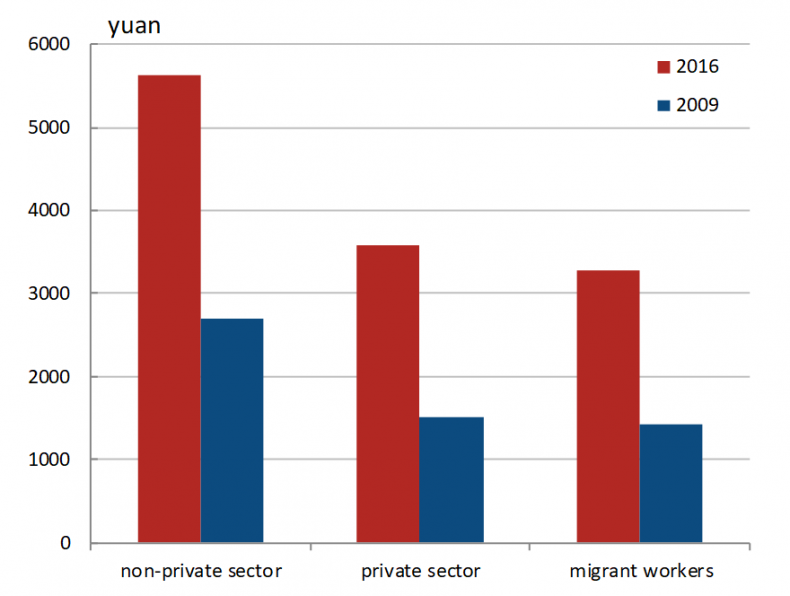
In sum, the Chinese statistical system provides different estimates of wages for three categories of workers: those employed in the non-private sector, in the private sector, and among rural migrants. The highest level of wages is documented by the official statistics for the non-private sector. According to the latest available data, in 2016 the average monthly wages for those employed in the non-private sector equaled 5,631 yuan ($850). For those employed at state-owned enterprises, the average monthly wages amounted to 6,045 yuan ($913).
However, these figures should not be used as an indicator of Chinese labor costs in general. In the private sector and among rural migrants, the level of remuneration is significantly lower, thus driving down the average level of wages in the economy. According to NBS data, average monthly wages for those employed in private enterprises and rural migrants stood at 3,569 yuan ($539) and 3,275 yuan ($495) respectively.
Using the above-mentioned data on wages and employment numbers for different categories of workers, one can estimate the average wages for workers in urban areas. The results of this exercise will naturally lie somewhere between the two extremes (wages in non-private sector and rural migrants) depending on the specific weights. However this indicator still provides only limited coverage of the Chinese labor market, as information about wages in rural areas is missing.

Monthly wages by categories of workers in the Chinese economy in 2016. Data from NBS.
Rising Inequality Should Be Taken Into Account
Although it is extremely difficult to gauge with a high degree of certainty the actual level of wages in China, there are no doubts about the general trend. No matter which indicators are employed, they all point out that wages have more than doubled since the year 2009. Such a pace of growth obviously has serious implications for the Chinese labor market and its international competitiveness in terms of relative wages. The pool of cheap labor has definitely dried up. However, when talking about China in general one should not only look at average numbers but also take into consideration total figures.
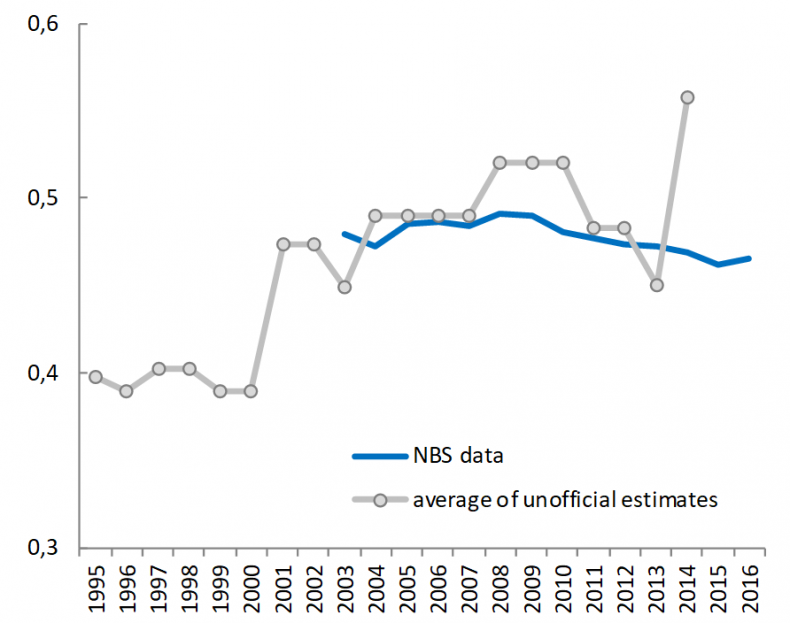
The average wages have risen significantly in recent years. But there are also signs that income inequality remains high and may be even increasing. According to the official NBS estimates, the value of the Gini coefficient – one of the most common indicators of inequality – stood at 0.47 in 2016. The NBS resumed the publication of Gini coefficient in the early 2000s. Since the year 2010 official estimates have exhibited some degree of downward trend, meaning less inequality. At the same time, unofficial estimates derived from population surveys in recent years appear to be higher than official ones, which may indicate a further increase in inequality among the population. The rise of income inequality can mean that the pool of cheap labor can actually be drying up more slowly, even with the rapid growth of the average wage level.

Official and unofficial estimates of Gini coefficient in China in 1995-2016. Official data from NBS; unofficial data from UNU-WIDER database.
A brief calculation can be provided to illustrate this point. According to the latest available data from the China Labor-force Dynamics Survey, the average wage for the 20 percent of the highest-paid workers was 14 times higher than the average level of wages for the 20 percent of workers belonging to the low-income group. If we assess the average wage as equal to 4,200 yuan per month ($632) and use the 2014 data on income distribution by population groups, it can be assumed that the 20 percent of low-paid workers in 2016 received a salary of 650 yuan per month (or about $100). Remember that 20 percent of Chinese workers constitutes a population group of about 150 million people, which actually exceeds the population of most European and Asian countries. Thus, it can be argued that the pool of cheap labor in China may be shrinking, but the size of the remaining pool is still quite large as compared with other countries.
The following conclusion can be drawn from the above analysis: The average numbers are important, but one should not overlook the structural characteristics of data. International comparisons of Chinese wages were quite simple in the past when the level of labor pay was extremely low. In recent years the situation has changed as the wage gap between workers in China and other parts of the world has decreased. As a consequence, the importance of quality of the official statistics became more pronounced in cross-country comparisons. Under the new circumstances, even a small margin of error and any data inaccuracies can significantly influence the results of international comparisons and thus conclusions for economic policy.
All in all, researchers and analysts should shift their focus from average wages on a country level to wages in specific industries and for particular occupations. This type of analysis, of course, requires more detailed and more accurate data. Thus extra efforts from the part of the Chinese official statisticians will be needed in the future to improve statistics on wages.
Dmitriy Plekhanov is a senior researcher at the Institute for Complex Strategic Studies (ICSS), a Russian-based think tank. He is also a lecturer at the Lomonosov Moscow State University Business School (Lomonosov MSUBS)
No comments:
Post a Comment