June 25, 2014
 Editor’s note: We’ve partnered with the National Consortium for the Study of Terrorism and Responses to Terrorism (START) to publish a series of infographics based on data from their Global Terrorism Database and related START projects. Each week we’ll release a new set of graphics that depict trends in global terrorism activity. Sign up for the War on the Rocks newsletter to make sure you don’t miss any of them!
These graphics were designed by START’s William Kammerer, Michael Jensen, and Brian Wingenroth.
Suicide terrorism is a difficult phenomenon for us to conceptualize. It’s very existence seems to directly contradict much of what we know about basic human survival instincts, which clearly has ramifications for the ways in which we seek to measure such intangible factors as radicalization and ideological commitment. Our understanding of suicide terrorism can also vary depending on whether it is based on the qualitative examination of particular case studies, some other empirical methodology, or attacks perpetrated by specific groups or types of groups. By relying on START’sGlobal Terrorism Database, however, which includes details of more than 113,000 terrorist attacks since 1970, some very noteworthy, macro-level conclusions become apparent.
Figure 1 depicts the geographic distribution of both non-suicide and suicide terrorist attacks in 2013.
As we noted in our first infographic on worldwide terrorism trends, terrorism was a widespread phenomenon in 2013, impacting 94 of the world’s countries. By comparison, suicide terrorism, while still common, was far more geographically isolated last year. Suicide attacks occurred in 24 countries, the majority of which are found in Africa, the Middle East, and South Asia. The geographic isolation of suicide terrorism is likely driven by myriad causes, but one worth noting is the physical presence of a distinct set of groups that have adopted the tactic as a central feature of their armed campaigns. This list includes a number of al-Qaeda-linked groups, such as al-Shabaab in Somalia and Kenya; Boko Haram in Nigeria; al-Qaeda in the Arabian Peninsula in Yemen; and the Islamic State of Iraq and the Levant in Iraq and Syria.
Figure 1: Geographic distribution of suicide and non-suicide attacks, 2013
 What if we look at the frequency of suicide terrorism over a much longer time period? The line chart in Figure 2 shows the real number of suicide attacks by year, while the pie charts show their frequency as a proportion of overall terrorist attacks in each of four decades. These charts display that, although not a new tactic, suicide attacks have grown rapidly and became a common feature of global terrorism by the 2000s. Also of note, there was a considerable drop in the number of suicide attacks from 2007 to 2010. This was due in part to patterns of violence in Iraq, where after recording 201 suicide attacks in 2007, the number dropped in each of the subsequent four years. That decrease in global suicide terrorism levels is beginning to look like an anomaly, however, and future years will reveal whether the longer-term upward trend is dominant.
Figure 2: Suicide and non-suicide attack frequency, 1970-2013
 Finally, Figure 3 compares casualty data for suicide attacks to that of eight categories of non-suicide attacks. The results are striking. Whether the comparison is based on the number of fatalities produced or the number of victims left wounded, the casualty toll of suicide attacks is more than twice (and in most cases, many times) that of any non-suicide attack type. Consider, for example, the comparison of suicide and non-suicide bombings. Despite relying on similar weapons, suicide attacks produced nearly ten times as many fatalities and nearly seven times as many injuries as non-suicide bombings through 2013. Insofar as terrorism’s objective is to sow violence, then, suicide attacks are thus remarkably effective, because they integrate human decision-making into the weapon itself. This is why the suicide terrorist has been called “the ultimate smart bomb.”
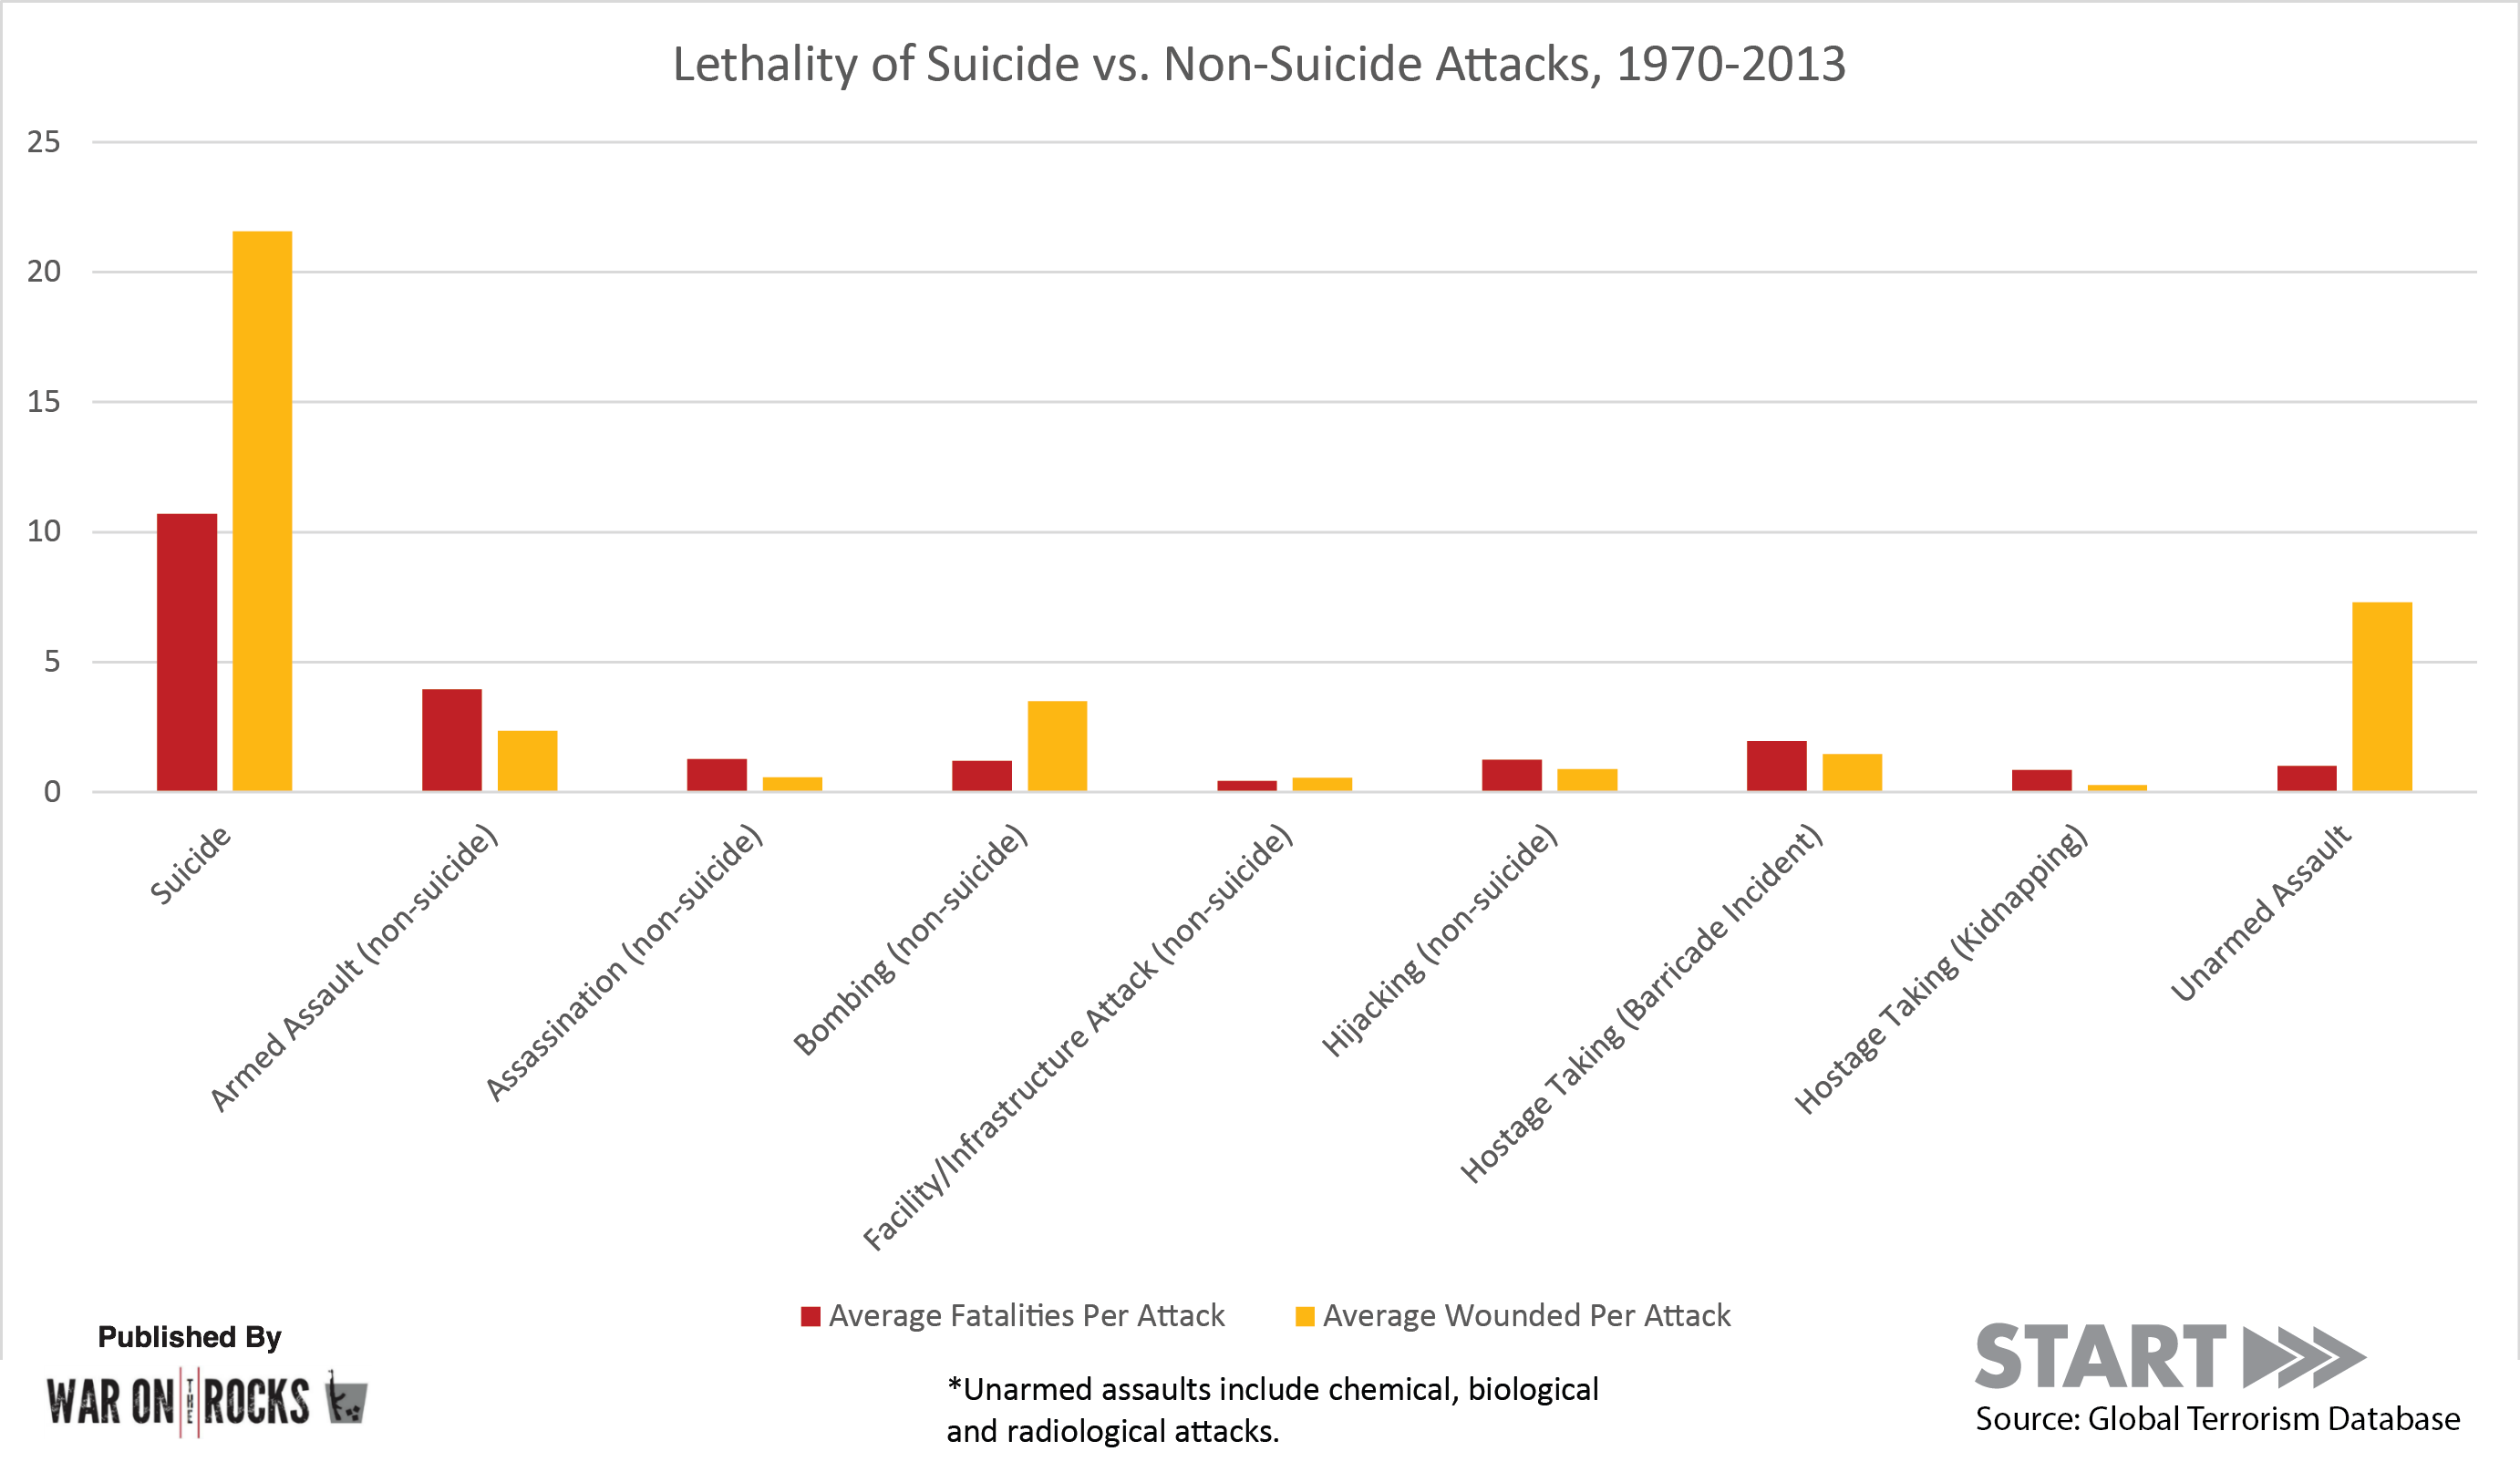
Figure 3: Lethality of suicide and non-suicide attacks, 1970-2013 (click to enlarge)

This graphic is based on preliminary data that is subject to change. 2013 GTD data is not yet available for public download or distribution. It will be released via the GTD website later this summer.
Beginning with 2012 data collection, START made several important changes to the GTD collection methodology, improving the efficiency and comprehensiveness of the process. In general, comparisons of aggregate statistics over time and between locations should be interpreted with caution due to these methodological improvements, as well as the considerable variation in the availability of source materials.
No comments:
Post a Comment